
WSL 2025-26 Mid-Season Review: League-wide Trends and End of Season Projections (Part 3)
How finishing efficiency, pressing styles, and set-piece execution separate title contenders from playoff battlers – plus data-driven projections for the season’s defining races

Having analysed all 12 teams individually in part 1 and 2, clear tactical patterns emerge that define the 2025-26 season. Three trends – finishing quality, pressing intensity, and set-piece effectiveness – separate successful teams from strugglers. Combined with underlying performance metrics, these trends reveal not just where teams stand at mid-season, but where they’re likely headed by May.
Finishing & Chance Quality: The Great Divide
As established in Part 1, the league faces a defining paradox. Teams are creating better chances – expected goals have jumped from 2.42 to 2.91 per game – yet they’re scoring at virtually the same rate (2.94 goals per game). This league-wide average, however, masks extreme polarisation between clinical finishers and wasteful sides.
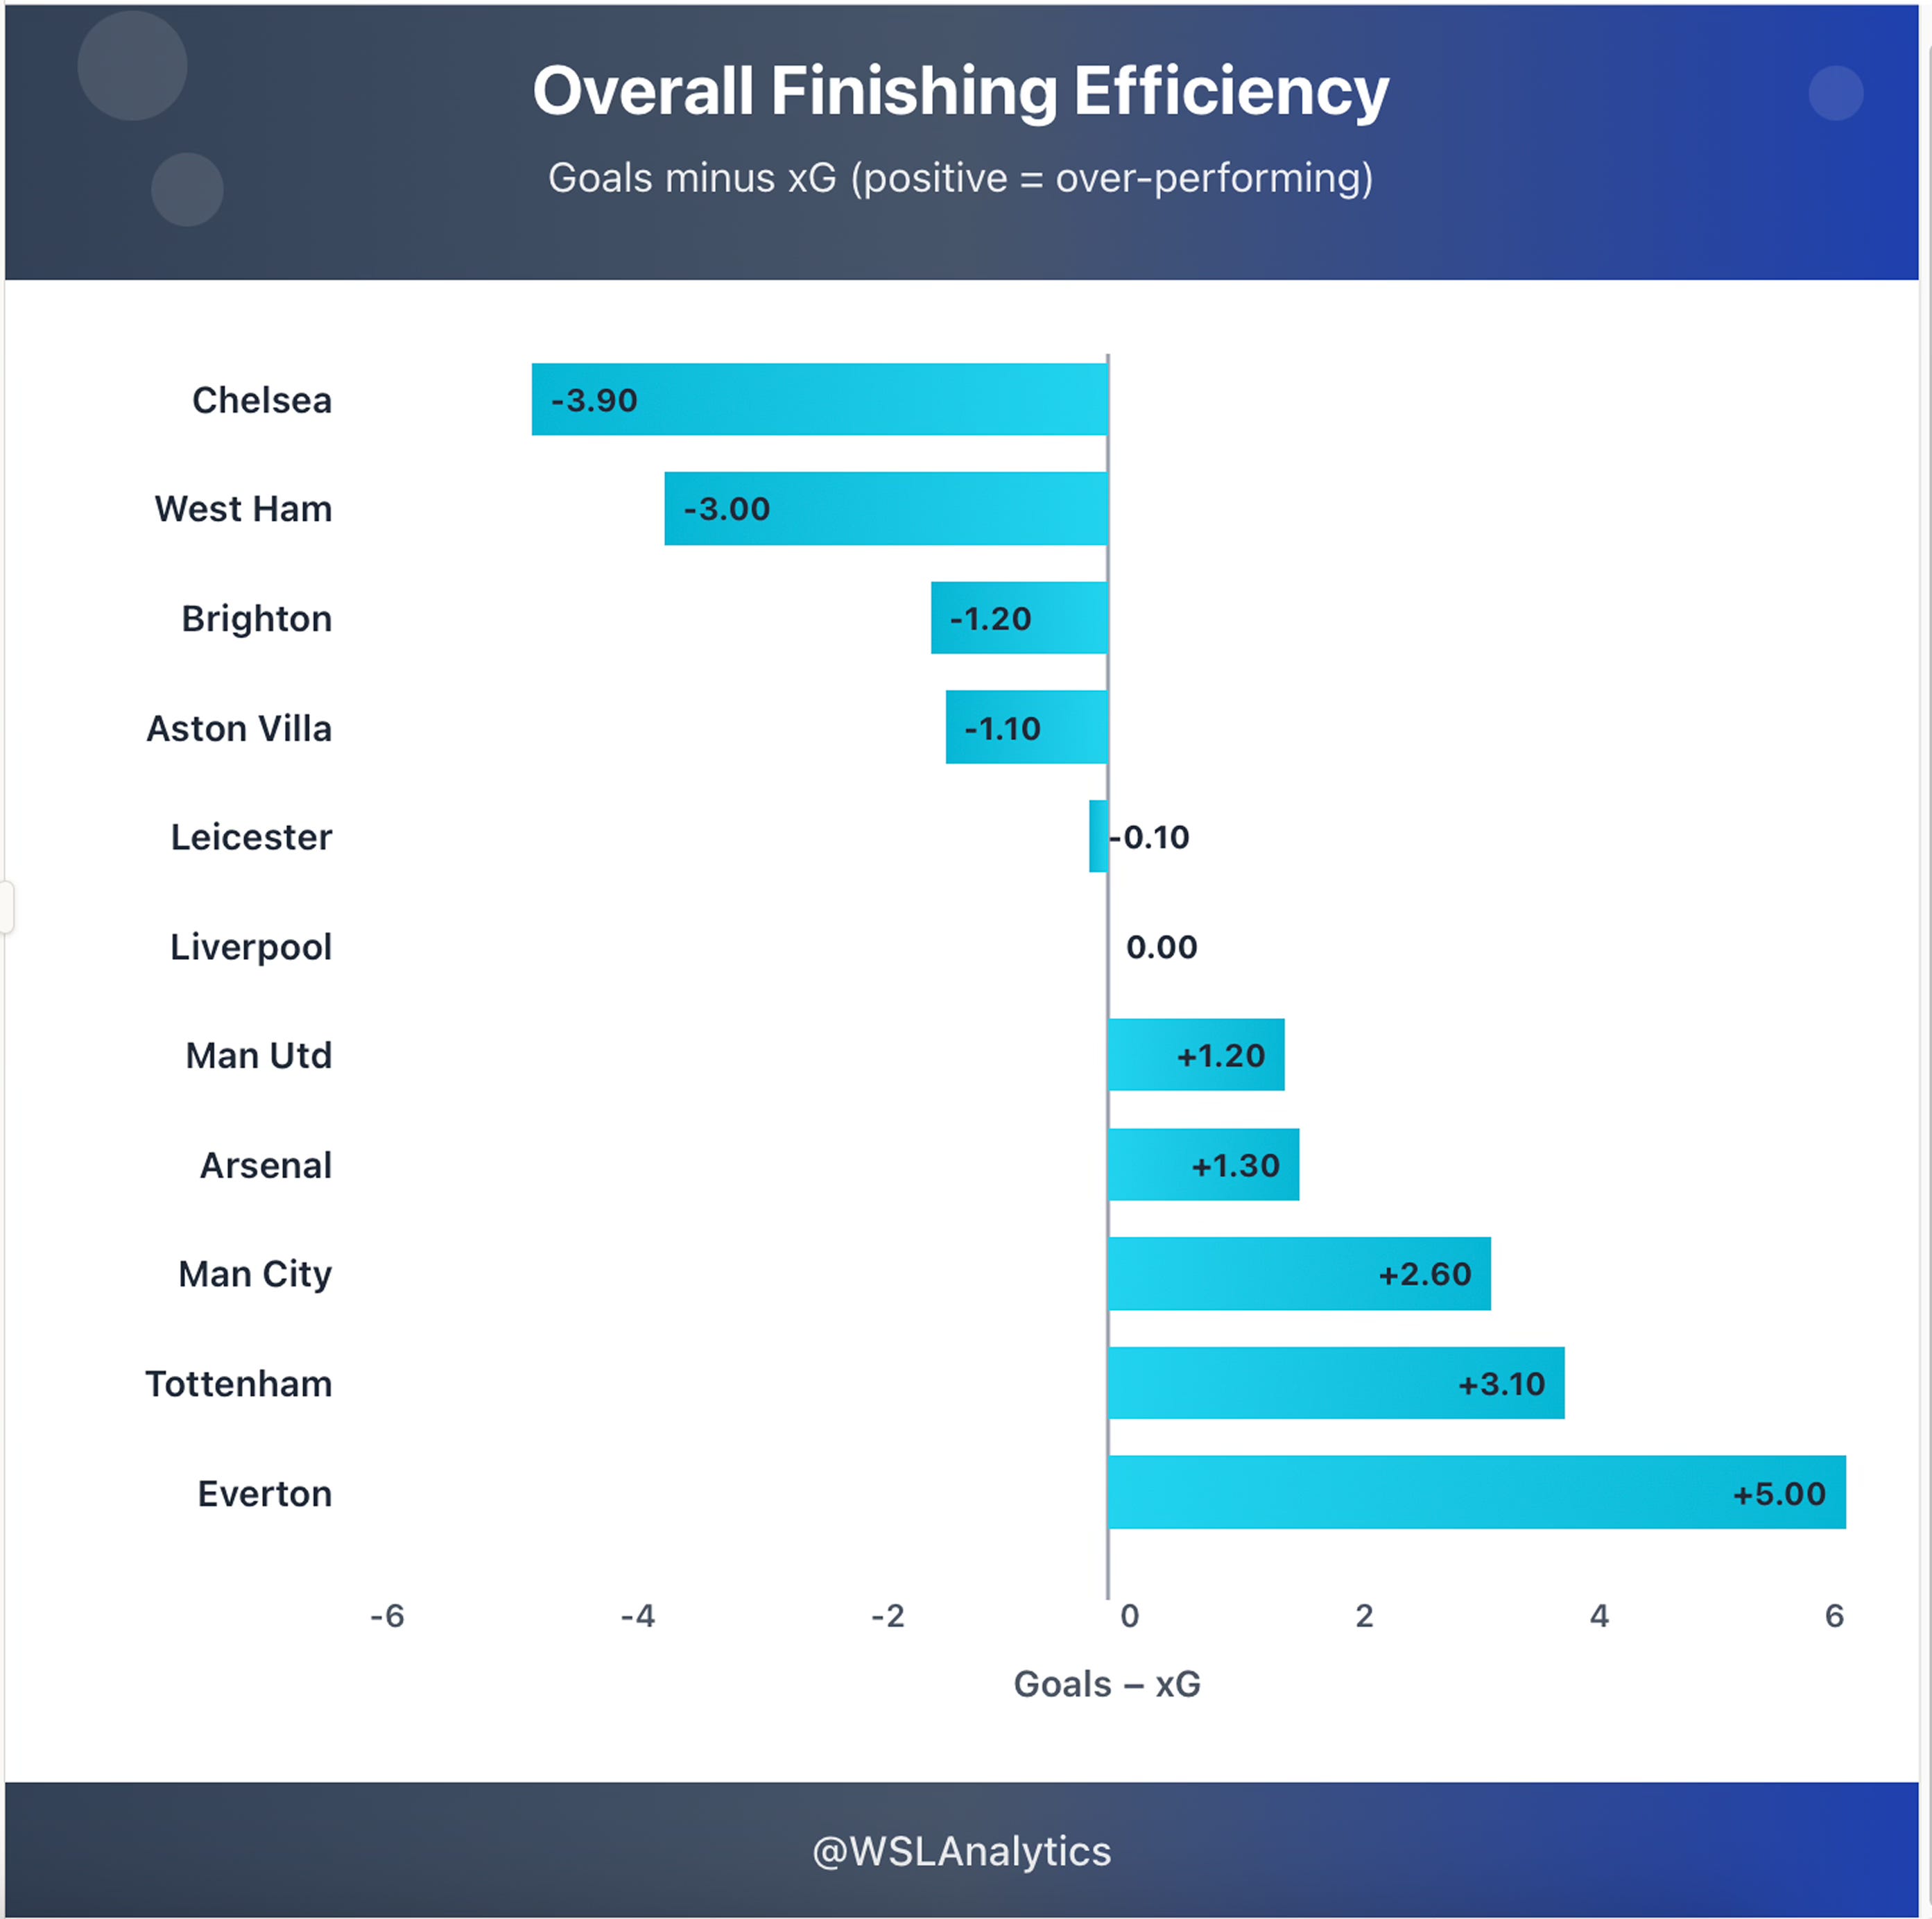
Everton have outscored their xG the most (+5.0), with Spurs (+3.1) and Man City (+2.6) also above xG, while Chelsea (–3.9) and West Ham (–3.0) are scoring well below expectation.
The Clinical Elite
Manchester City exemplify ruthless efficiency. With a goal difference 20 goals better than expected, they’re not just creating chances – they’re making them count. In their 6-1 thrashing of Aston Villa, City converted their opportunities with ruthless efficiency, scoring six times from 3.9 expected goals (xG).
Tottenham’s transformation follows a similar blueprint. Their 3-3 draw at United – where they scored three goals from just five shots – captures their clinical approach perfectly. They don’t need volume; they convert their best chances with ruthless precision.
These teams prove the formula: chance quality trumps quantity. Create fewer but better opportunities, then finish them without mercy.
The Wasteful
Manchester United’s 3-3 draw with Spurs tells the opposite story: 34 shots, nearly 5.0 xG, hitting the woodwork four times, yet they needed a late rally just to salvage a point. United dominate possession and create chances in abundance, but wasteful finishing undermines everything.
Chelsea’s loss to Everton was even more damning: 79% possession, 30 shots to 4, 1.50 xG created – and they still lost. Complete territorial domination meant nothing without goals.
Arsenal aren’t far behind in the wastefulness stakes. They dominate games but fail to finish opponents off, inviting pressure late on. Their draw with Aston Villa perfectly illustrates the problem: 67% possession, 2.69 xG, 19 shots to 13 – yet they conceded an equaliser in the 90+4 minute.
All the possession and chances in the world mean nothing if you can’t finish.
The Bottom’s Struggles
For relegation battlers, finishing issues compound defensive problems. Liverpool have scored just 8 goals despite Beata Olsson’s best efforts. Leicester’s 7 goals through 11 matches reflects similar attacking struggles. West Ham tell the same story: their 9 goals – nearly half from set-pieces – shows their open-play problems.
The pattern is clear: teams that can’t finish AND can’t defend face relegation. Master one discipline (Tottenham’s defence, Everton’s attack) and you can survive. Excel at both (City) and you lead the pack. Chelsea and Arsenal are right in the title race with strong defensive foundations – but their finishing problems could be what costs them the trophy. Fail at both and you’re in serious trouble.
Pressing Styles: The Tactical Spectrum
The WSL’s pressing landscape isn’t defined by one trend – it’s a spectrum. After 11 matches, the league ranges from Chelsea’s ultra-aggressive approach (9.1 PPDA – passes allowed per defensive action) to Leicester’s passive style (15.4). The lower the number, the more intense the press: Chelsea engage after roughly 9 opposition passes, while Leicester sit back and allow 15.
But intensity alone doesn’t tell the full story. Where teams start their press, how often they win the ball back, and what they do with those turnovers – these details reveal fundamentally different philosophies.
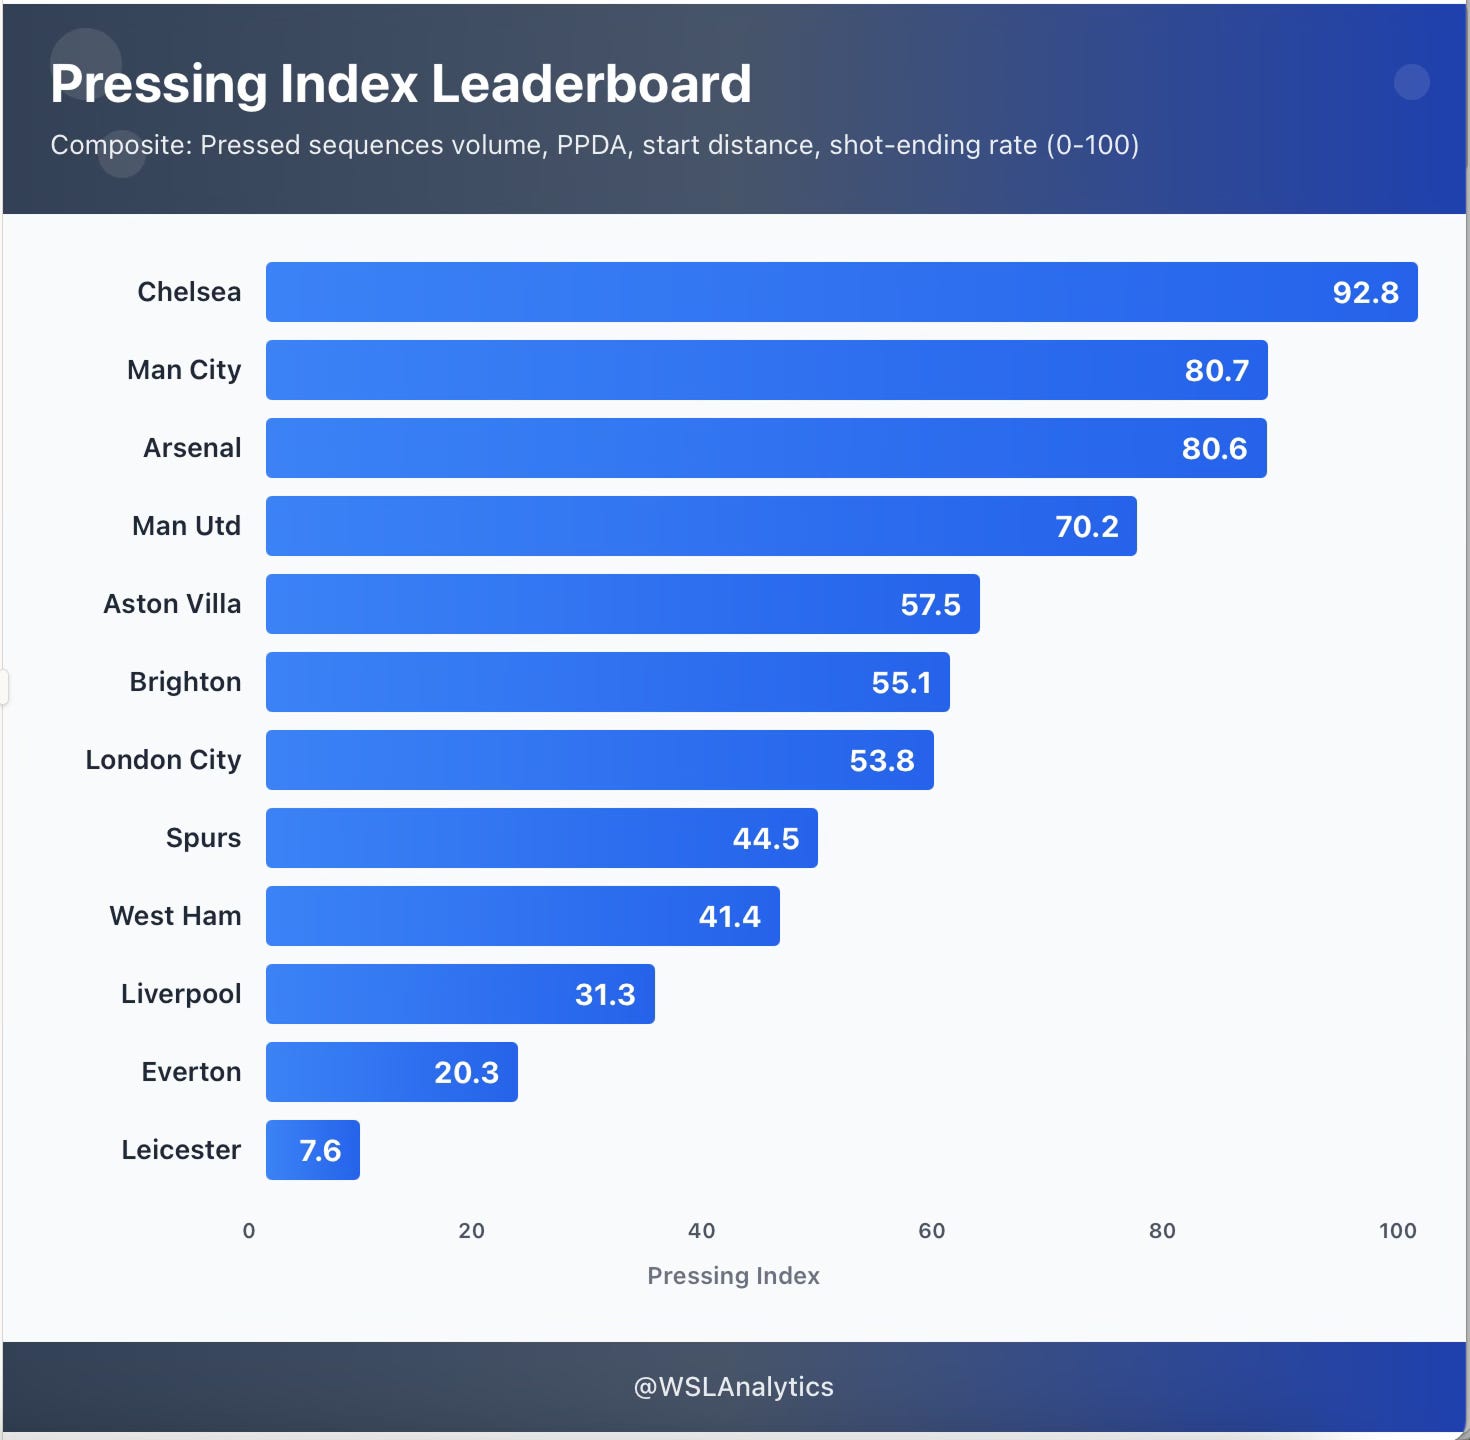
Chelsea are the league’s standout pressers (92.8), with Man City (80.7) and Arsenal (80.6) the closest challengers, while Leicester sit adrift at the bottom (7.6).
The High-Press Leaders – Intensity and Territorial Control
Chelsea set the league’s intensity benchmark. They have the lowest PPDA (9.1) and turn pressure into goals better than anyone. Of their 159 pressed sequences, 34 become shots (21.4% – best in the league) and 3 become goals.
This is pressing with clear attacking purpose: win it high, create immediately.
Manchester City press almost as aggressively (PPDA 9.8) and lead the league in volume with 178 pressed sequences. The difference is what they do after winning the ball. Only 16 of those sequences become shots (10.0%) and just 1 becomes a goal.
City’s press isn’t designed to create immediate chances. They use it to disrupt opponents and win field position, then attack with structure rather than chaos.
Arsenal press differently again. Their PPDA (11.0) is slightly less extreme, but they start their press higher up the pitch than anyone (average 50 metres from their own goal). And it carries the sharpest payoff: 6 goals from pressed sequences (league-high) and 26 shots from 163 attempts (16.0%).
Arsenal’s press isn’t just territorial – it’s one of the league’s most punishing when they win the ball high.
Manchester United sit in the same proactive lane: PPDA 10.6, turning 24 of their 149 pressed sequences into shots (16.1%) and 3 into goals. Like Chelsea, they press with intent to create quickly rather than just control.
The Pragmatists – Selective Pressure, High Efficiency
This is where the league gets interesting.
Tottenham show how selective pressing can be lethal. Their PPDA (10.9) proves they can apply real pressure, though their average start point (42.1m – notably deeper than the high-press leaders) suggests a more measured approach.
The key is efficiency: 19 shot-ending sequences from just 93 pressed sequences (20.4% – second-best in the league) and 3 goals. Spurs don’t need volume to be dangerous – their press is built for high-value moments.
London City Lionesses operate similarly (42.4m average depth) and still convert pressure into chances: 16 shots from 90 sequences (17.8%) and 2 goals. This isn’t relentless pressing – it’s opportunistic, picking moments carefully.
Brighton press from similar depth (42.8m) and produce steady threat: 16 shot-ending sequences and 2 goals.
West Ham also sit deeper (41.8m) and generate shots from their press (14), but haven’t converted a single pressing sequence into a goal all season. For them, pressing is about territorial protection rather than creating chances.
The Passive End – Less Pressure, Less Payoff
At the bottom of the spectrum are teams whose pressing either lacks intensity or fails to create chances.
Leicester have the league’s most passive approach (PPDA 15.4) and it shows in the returns: just 6 shots from 86 pressed sequences (6.98% – lowest in the league) and zero goals. They’re allowing opponents to play through them.
Liverpool sit almost as passively (PPDA 14.3), despite starting their press relatively high (45.3m). They generate slightly better returns – 12 shots from 120 sequences (10.0%) and 2 goals – but the low intensity limits their threat from pressing.
Everton start deepest of all (40.7m average), defending in a low block. They convert 13.13% of their pressed sequences into shots and have managed 1 goal, but their deep positioning fundamentally limits how dangerous they can be from winning the ball back.
These passive approaches make it harder to create sustained threats. Without pressing aggressively or winning the ball high, these teams struggle to generate goal-scoring opportunities from defensive actions.
The Key Takeaway
Pressing in the WSL isn’t one-size-fits-all. It’s a spectrum of tactical identities:
Chelsea press to create – converting 21.4% of sequences into shots
Manchester City press to control – high volume, low immediate threat
Arsenal press highest – and get the league’s best goal return (6 goals)
Tottenham press selectively – fewer moments, ruthless efficiency
The question isn’t who presses most – it’s who presses smartest. As the season deepens, fatigue and squad depth will reveal which approaches are sustainable. But the mid-season message is clear: there’s no single pressing blueprint in the WSL, and each philosophy shapes outcomes in fundamentally different ways.
Set Plays – The Great Equaliser (But Not Where Expected)
Arsenal have created elite set-piece chances (4.68 xG, third-best in the league). They’ve scored once. Only Liverpool have a worse conversion rate, but Arsenal’s failure is far more costly – they’re wasting nearly five goals worth of quality chances. In a tight title race, that could be the difference between first and third.
Method note: Set plays here mean corners and free kicks only. Penalties are excluded.
The Numbers Tell Two Stories
The headline figure: set plays account for 10.9% of goals this season (32 of 294, excluding penalties – which are more about individual execution than delivery and routine).
That sounds modest. It isn’t. Behind that average sits wild variation – some teams are scoring nearly half their goals from set pieces, while others with elite delivery are wasting chances week after week.
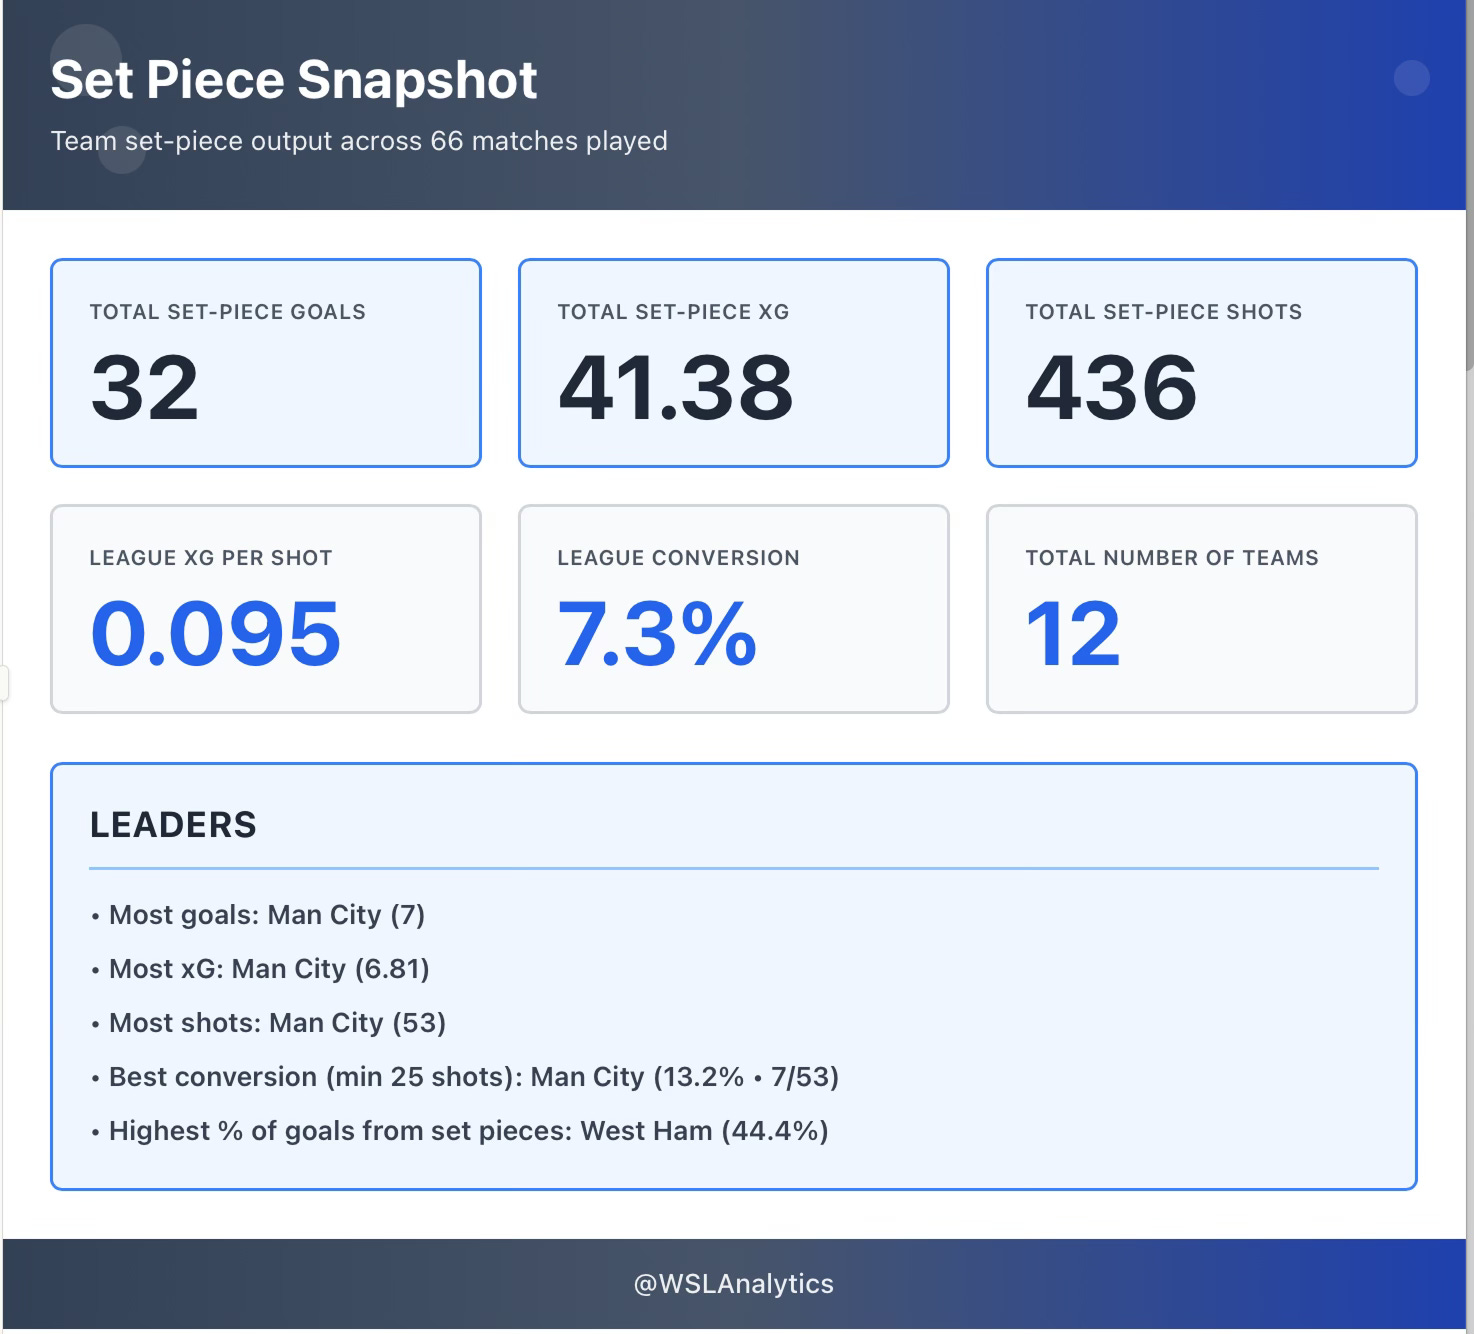
Across 66 matches, set pieces (corners and free kicks) have produced 32 goals from 41.38 xG (7.3% conversion on 436shots), with Man City leading for output and volume (7 goals, 6.81 xG, 53 shots; 13.2% conversion) and West Ham the most reliant (44.4% of goals from set pieces).
The Efficiency Kings
Aston Villa are the standout story. They’ve scored 5 goals from just 2.62 xG – 2.4 more than the quality of their chances suggests. That’s the league’s best overperformance. 35.7% of Villa’s goals come from set plays. This isn’t a bonus feature – it’s central to how they score.
Manchester City lead on volume with 7 set-play goals from 6.81 xG – converting with ruthless reliability. But the real story is scale: City have taken 53 set-play shots, the most in the league. Their dominance doesn’t stop at open play; they’re creating the most dead-ball danger too.
West Ham and London City have both scored 4 set-play goals, but their profiles differ sharply. For West Ham, those 4 goals represent 44.4% of their total output. Set plays aren’t a complement to their attack – they are the attack. London City have created 3.28 xG and scored 4 goals – solid efficiency for a mid-table side.
The Problem at the Top
Here’s where it gets uncomfortable for the title contenders.
Arsenal have generated 4.68 set-play xG – excellent underlying numbers – but scored just 1 goal. That’s a -3.68 gap. Put simply, based on their shot positions, Arsenal should have scored nearly 4 more goals from set plays this season.
Set plays account for over 21% of Arsenal’s total xG, but only 4.35% of their goals. The platform is there. The execution is not.
Chelsea show a similar pattern: 4.90 set-play xG (second-highest in the league) for 2 goals. That’s a -2.90 shortfall. The volume is championship-level. The returns aren’t.
Liverpool remain the outlier: 0 set-play goals from 1.12 xG. It’s a small sample, but even one missing goal adds up over a season.
Why This Matters
Set plays aren’t marginal gains – they’re genuine competitive separators, especially for teams whose open-play margins are thin.
West Ham are proof: nearly half their goals come from set pieces. Without that efficiency, they’d be in serious trouble. Villa have turned set-piece execution into a tactical advantage that significantly outperforms their underlying numbers.
Meanwhile, Arsenal and Chelsea are generating elite set-piece chances and leaving goals on the table. If Arsenal convert even half of their 4.68 xG – turning that 1 goal into 3 – that’s potentially several more points in a title race that could be decided by the smallest margins.
The finishing crisis and set-piece efficiency are two sides of the same coin. Teams like Arsenal and Chelsea dominate possession and create elite set-piece chances – yet waste both. Meanwhile, sides like Villa and West Ham compensate for limited open-play threat by ruthlessly converting dead balls.
Clinical finishing from all situations – open play and set pieces – separates the title contenders from the rest. City and Chelsea have the volume. Villa and Spurs have the efficiency. Arsenal have the chances but not the goals. In a league where everyone’s creating more but scoring the same, the teams that maximise every opportunity will pull clear.
Looking Ahead: What the Numbers Say About the Second Half
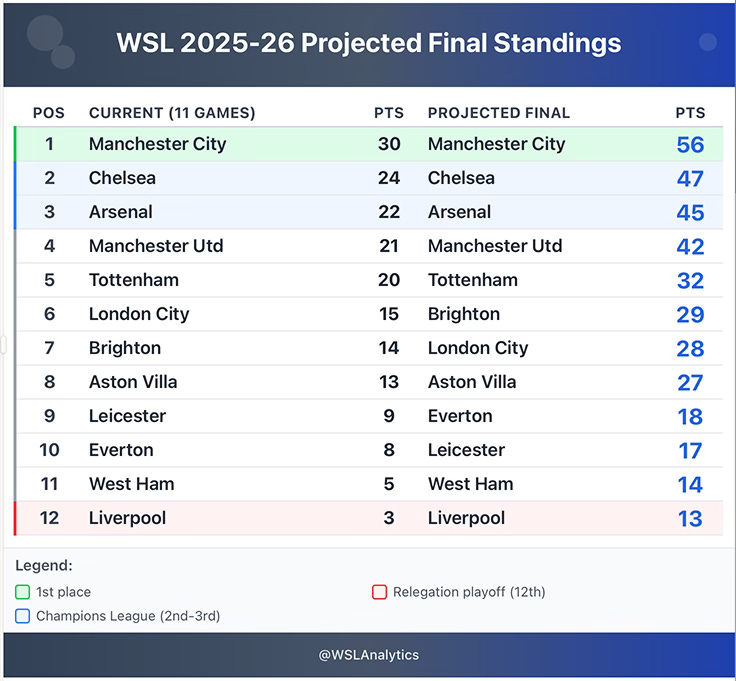
At the halfway point, Manchester City lead with 30 points, Chelsea sit on 24, and Arsenal on 22. A 6-8 point gap feels manageable – but the underlying numbers tell a different story. Based on current performance metrics including home advantage factors, here’s what the data projects for the season’s two defining battles:
The Title Race: City’s to Lose
Manchester City (Current: 30pts, 1st | Projected: 56 points | Title: 91.8% | UWCL: 99.9%)
City’s dominance is real. Their +20.6 xGD (+1.87 per 90) is nearly double Chelsea’s +12.0, and they’ve only lost one game all season – the opener against Chelsea. The model projects 56 points – extending their 6-point lead to 8-9 by season’s end.
Here’s where it gets interesting: City’s worst-case scenario (50 points) overlaps with Chelsea’s best-case (54 points). The title isn’t sealed. If Arsenal fix their set-piece conversion (currently wasting 4.68 xG) and City hit a rough patch, this stays competitive. The 91.8% title probability leaves room for drama – Chelsea (5.7% chance) and Arsenal (2.0%) remain mathematically alive. Their 99.9% UWCL qualification is the only certainty in this league.
The Champions League Race: Three Spots, Real Drama
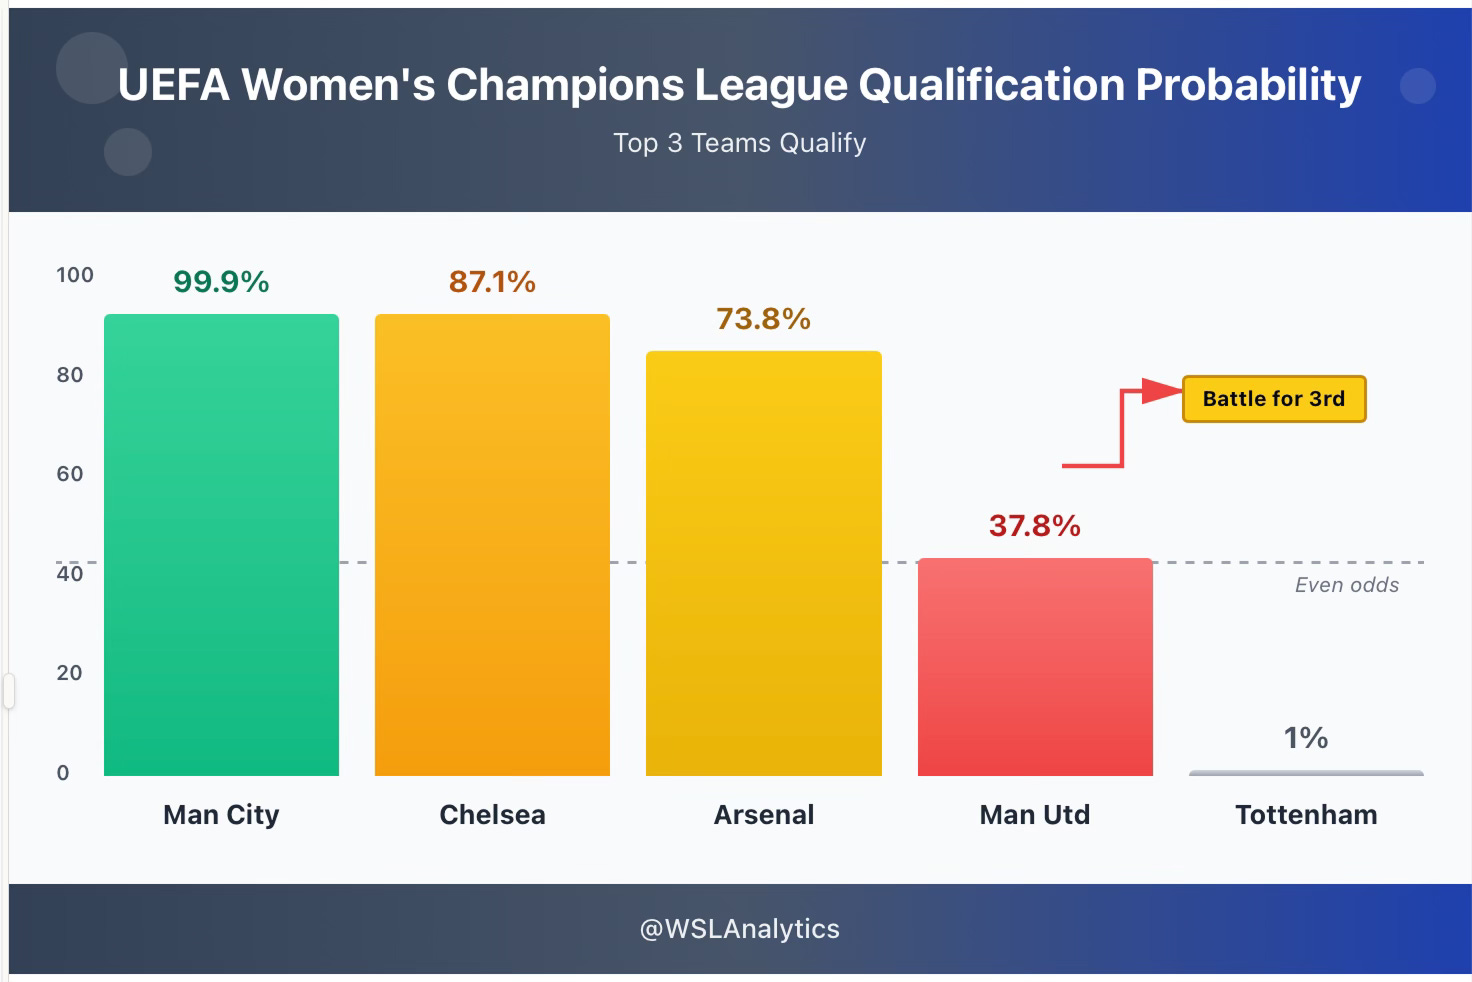
Man City (99.9%) and Chelsea (87.1%) are near-locks for UWCL qualification, Arsenal (73.8%) are strong favourites for the third spot, and Man Utd (37.8%) sit below even odds while Spurs are long shots (1%).
Only the top three qualify for the UEFA Women’s Champions League. While City are locked in (99.9%), the battle for second and especially third is wide open – and Arsenal are far from safe.
Chelsea (Current: 24pts, 2nd | Projected: 47 points | Title: 5.7% | UWCL: 87.1%)
Chelsea trail City by 6 points but are strong favourites for second place with an 87.1% UWCL qualification probability. Their underlying numbers (+12.0 xGD, +1.09 per 90) and projection (47 points, range: 40-54) suggest they’ll comfortably secure Champions League football.
But that 87% isn’t a guarantee – there’s a 13% chance they slip to fourth or below. Their wasteful finishing – that 79% possession, 30-shot loss to Everton – could cost them if it continues. Their 4.90 set-piece xG for 2 goals shows clear areas for improvement. The 5.7% title chance is essentially dead, but they need to maintain form to lock down second place.
Arsenal (Current: 22pts, 3rd | Projected: 45 points | Title: 2.0% | UWCL: 73.8%)
Here’s the season’s biggest story: Arsenal have just a 73.8% chance of UWCL qualification. That means there’s a 26.2% probability they miss Champions League football – more than 1-in-4 chance of disaster.
Their projection (45 points, range: 38-51) puts them 3 points ahead of United, but their +13.1 xGD (+1.19 per 90) suggests they should be comfortably in second. The culprit is obvious: 4.68 set-piece xG for 1 goal is criminal wastefulness. That late Villa equaliser (90+4’) typifies their season – dominating games but not finishing them off.
If Arsenal don’t fix their set-piece conversion immediately, Manchester United could genuinely steal their Champions League spot. This isn’t theoretical anxiety – it’s a real 26% risk that needs addressing now.
Manchester United (Current: 21pts, 4th | Projected: 42 points | Title: 0.5% | UWCL: 37.8%)
United have better than a 1-in-3 chance (37.8%) of stealing third place and Champions League qualification. Their projection (42 points, range: 35-49) has them finishing fourth, but that upper range (49 points) shows they could overtake Arsenal with strong form.
The maths is clear: United need to fix their wastefulness (34 shots, 5.0 xG for 3 goals vs Spurs) while hoping Arsenal’s set-piece struggles continue. At +9.6 xGD (+0.87 per 90), United’s underlying numbers aren’t as strong as Arsenal’s, but if regression to the mean helps their finishing while Arsenal keep leaving goals on the table, this becomes a genuine two-way race for third.
The UWCL Qualification Picture:
City: 99.9% – locked in
Chelsea: 87.1% – strong favourite for 2nd
Arsenal: 73.8% – vulnerable and under pressure
United: 37.8% – real contender with everything to play for
Tottenham: 1.0% – mathematical longshot requiring chaos above
The combined probability tells the story: there’s a 62.2% chance United finish outside the top three, but that also means they have better than 1-in-3 odds of making Champions League football. For Arsenal, there’s a 26.2% chance they miss Europe after being expected title contenders at the season start.
Arsenal need approximately 7-9 points from their remaining 11 matches to secure third. Drop points at home, and United – who need everything to click but have a clear path – could steal the final Champions League spot. This is the season’s defining battle.
The Relegation Playoff Battle: Who Faces Championship Football?
Finishing 12th means a playoff against WSL 2’s third-place finisher – not automatic relegation, but a high-stakes two-legged tie that could end a team’s top-flight status. Four teams face realistic playoff danger.
The Playoff Probabilities:
Liverpool: 44.1% (currently 12th) – even odds of playoff
West Ham: 34.1% (currently 11th) – better than 1-in-3 chance
Leicester: 12.0% (currently 9th) – roughly 1-in-8 if form collapses
Everton: 9.8% (currently 10th) – roughly 1-in-10, least at risk
Liverpool (Current: 3pts, 12th | Projected: 13 points | Playoff: 44.1%)
Liverpool currently occupy the playoff spot with 3 points and face 44.1% probability of staying there – essentially a coin flip for their top-flight status. The projection (13 points, range: 7-20) offers a narrow escape route: they could climb to 11th and avoid the playoff if they maximise home points.
But they’re winless through 11 matches (8 losses) with -8.2 xGD (-0.75 per 90). To reach 13 points requires finding 10 more from their remaining 11 games – meaning they need to suddenly start winning matches they’ve been losing all season. Home advantage might be their only lifeline, but the 44% playoff probability reflects brutal reality: they have even odds of facing a playoff to stay in the WSL.
West Ham (Current: 5pts, 11th | Projected: 14 points | Playoff: 34.1%)
West Ham sit one place above the playoff spot but face a 34.1% probability of finishing 12th – better than 1-in-3 chance of facing the drop. Just 5 points, one win all season, and unsustainable reliance on set pieces (44.4% of goals) reveal deep problems.
The projection (14 points, range: 8-21) shows they could survive with improved home form, but their underlying numbers are damning: -9.2 xGD (-0.84 per 90), zero goals from pressed sequences. When opponents adjust to their set-piece routines or their overperformance regresses, their goal supply could evaporate. They’re in a genuine two-way fight with Liverpool to avoid the playoff.
Leicester & Everton: On the Edge
Leicester (12.0% playoff risk) and Everton (9.8%) both sit on dire underlying numbers (-11.4 and -11.6 xGD respectively) but project to finish 9th-10th. Their roughly 1-in-10 playoff chances suggest they’ll survive – but one extended losing streak could drag them into the battle below.
The Bottom Line:
There’s a 78.2% probability that 12th place comes from Liverpool or West Ham. With just 1 point separating their projections (13 vs 14), their remaining fixtures and home form will decide who faces the playoff and who survives by the narrowest margin.
What Defines the Season:
Title Race: City’s 91.8% probability makes them overwhelming favourites, but Chelsea (5.7%) and Arsenal (2.0%) have realistic mathematical shots if finishing improves and City stumbles.
Champions League Race: This is where the real drama lives. Arsenal’s 73.8% UWCL qualification probability means 1-in-4 chance they miss Europe entirely. Manchester United’s 37.8% chance means better than 1-in-3 odds of stealing third place. This isn’t a comfortable lead – it’s a genuine two-way battle for the final Champions League spot.
Relegation Playoff: Liverpool (44.1%) and West Ham (34.1%) are in a desperate two-way fight to avoid 12th place. Leicester (12.0%) and Everton (9.8%) have outside risks, but the playoff will almost certainly feature one of the bottom two. Combined, there’s a 78% chance Liverpool or West Ham face the playoff – the question is which one.
The tactical trends we’ve analysed – finishing efficiency, pressing intelligence, set-piece conversion – directly shape these probabilities. Arsenal’s set-piece wastefulness could cost them Champions League football. West Ham’s reliance on dead balls could send them to a relegation playoff. The teams that adapt fastest will shift these odds, but the underlying numbers paint a clear picture of two defining battles that will shape the season’s final months.
Data & Methodology
All figures are WSL league matches only, through Matchweek 11 (11 matches per team; 66 matches total). Team and player statistics compiled from FotMob. Pressing statistics (PPDA, pressed sequences, start distance) and set-piece data compiled from Opta.
Projection Methodology
The end of season projections are based on current underlying performance metrics (xG, xGA) and form, adjusted for home advantage. These forecasts assume continuity in squad availability and tactical approach – they do not account for:
Injuries to key players
Suspensions
January transfer window additions or departures
Significant changes in any of these areas could materially shift projected outcomes.
Loved this!
Great piece this, even if it brutally exposes how poor Liverpool are.