
WSL 2025–26 Mid-Season Review: Mid-Table Ambitions and Relegation Play-off (Part 2)
From London City's managerial upheaval to Liverpool's winless spiral, we analyse mid-table volatility and relegation playoff crisis – and what the data reveals about sustainability.


Introduction
In Part 1, we examined the title race and top-five battle, where process versus results defined the Champions League chase. Now we complete the picture by analysing the remaining seven teams – from ambitious promoted sides and mid-table pragmatists to clubs facing a genuine relegation play-off crisis.
This is where fine margins separate sustainability from collapse. London City’s bold project sits one point ahead of Brighton’s defensive pragmatism and two ahead of Villa’s rebuilding foundations. Below them, the table compresses fast: Villa (13) to Everton (8) is a five-point swing, while Leicester (9) to West Ham (5) is only four points. In other words, a couple of results can flip the entire bottom-half narrative.
The data reveals which teams have built genuine foundations and which are papering over structural cracks. With the 12th-placed side set to face a promotion/relegation play-off against third in WSL2, the second half will ruthlessly expose the difference.
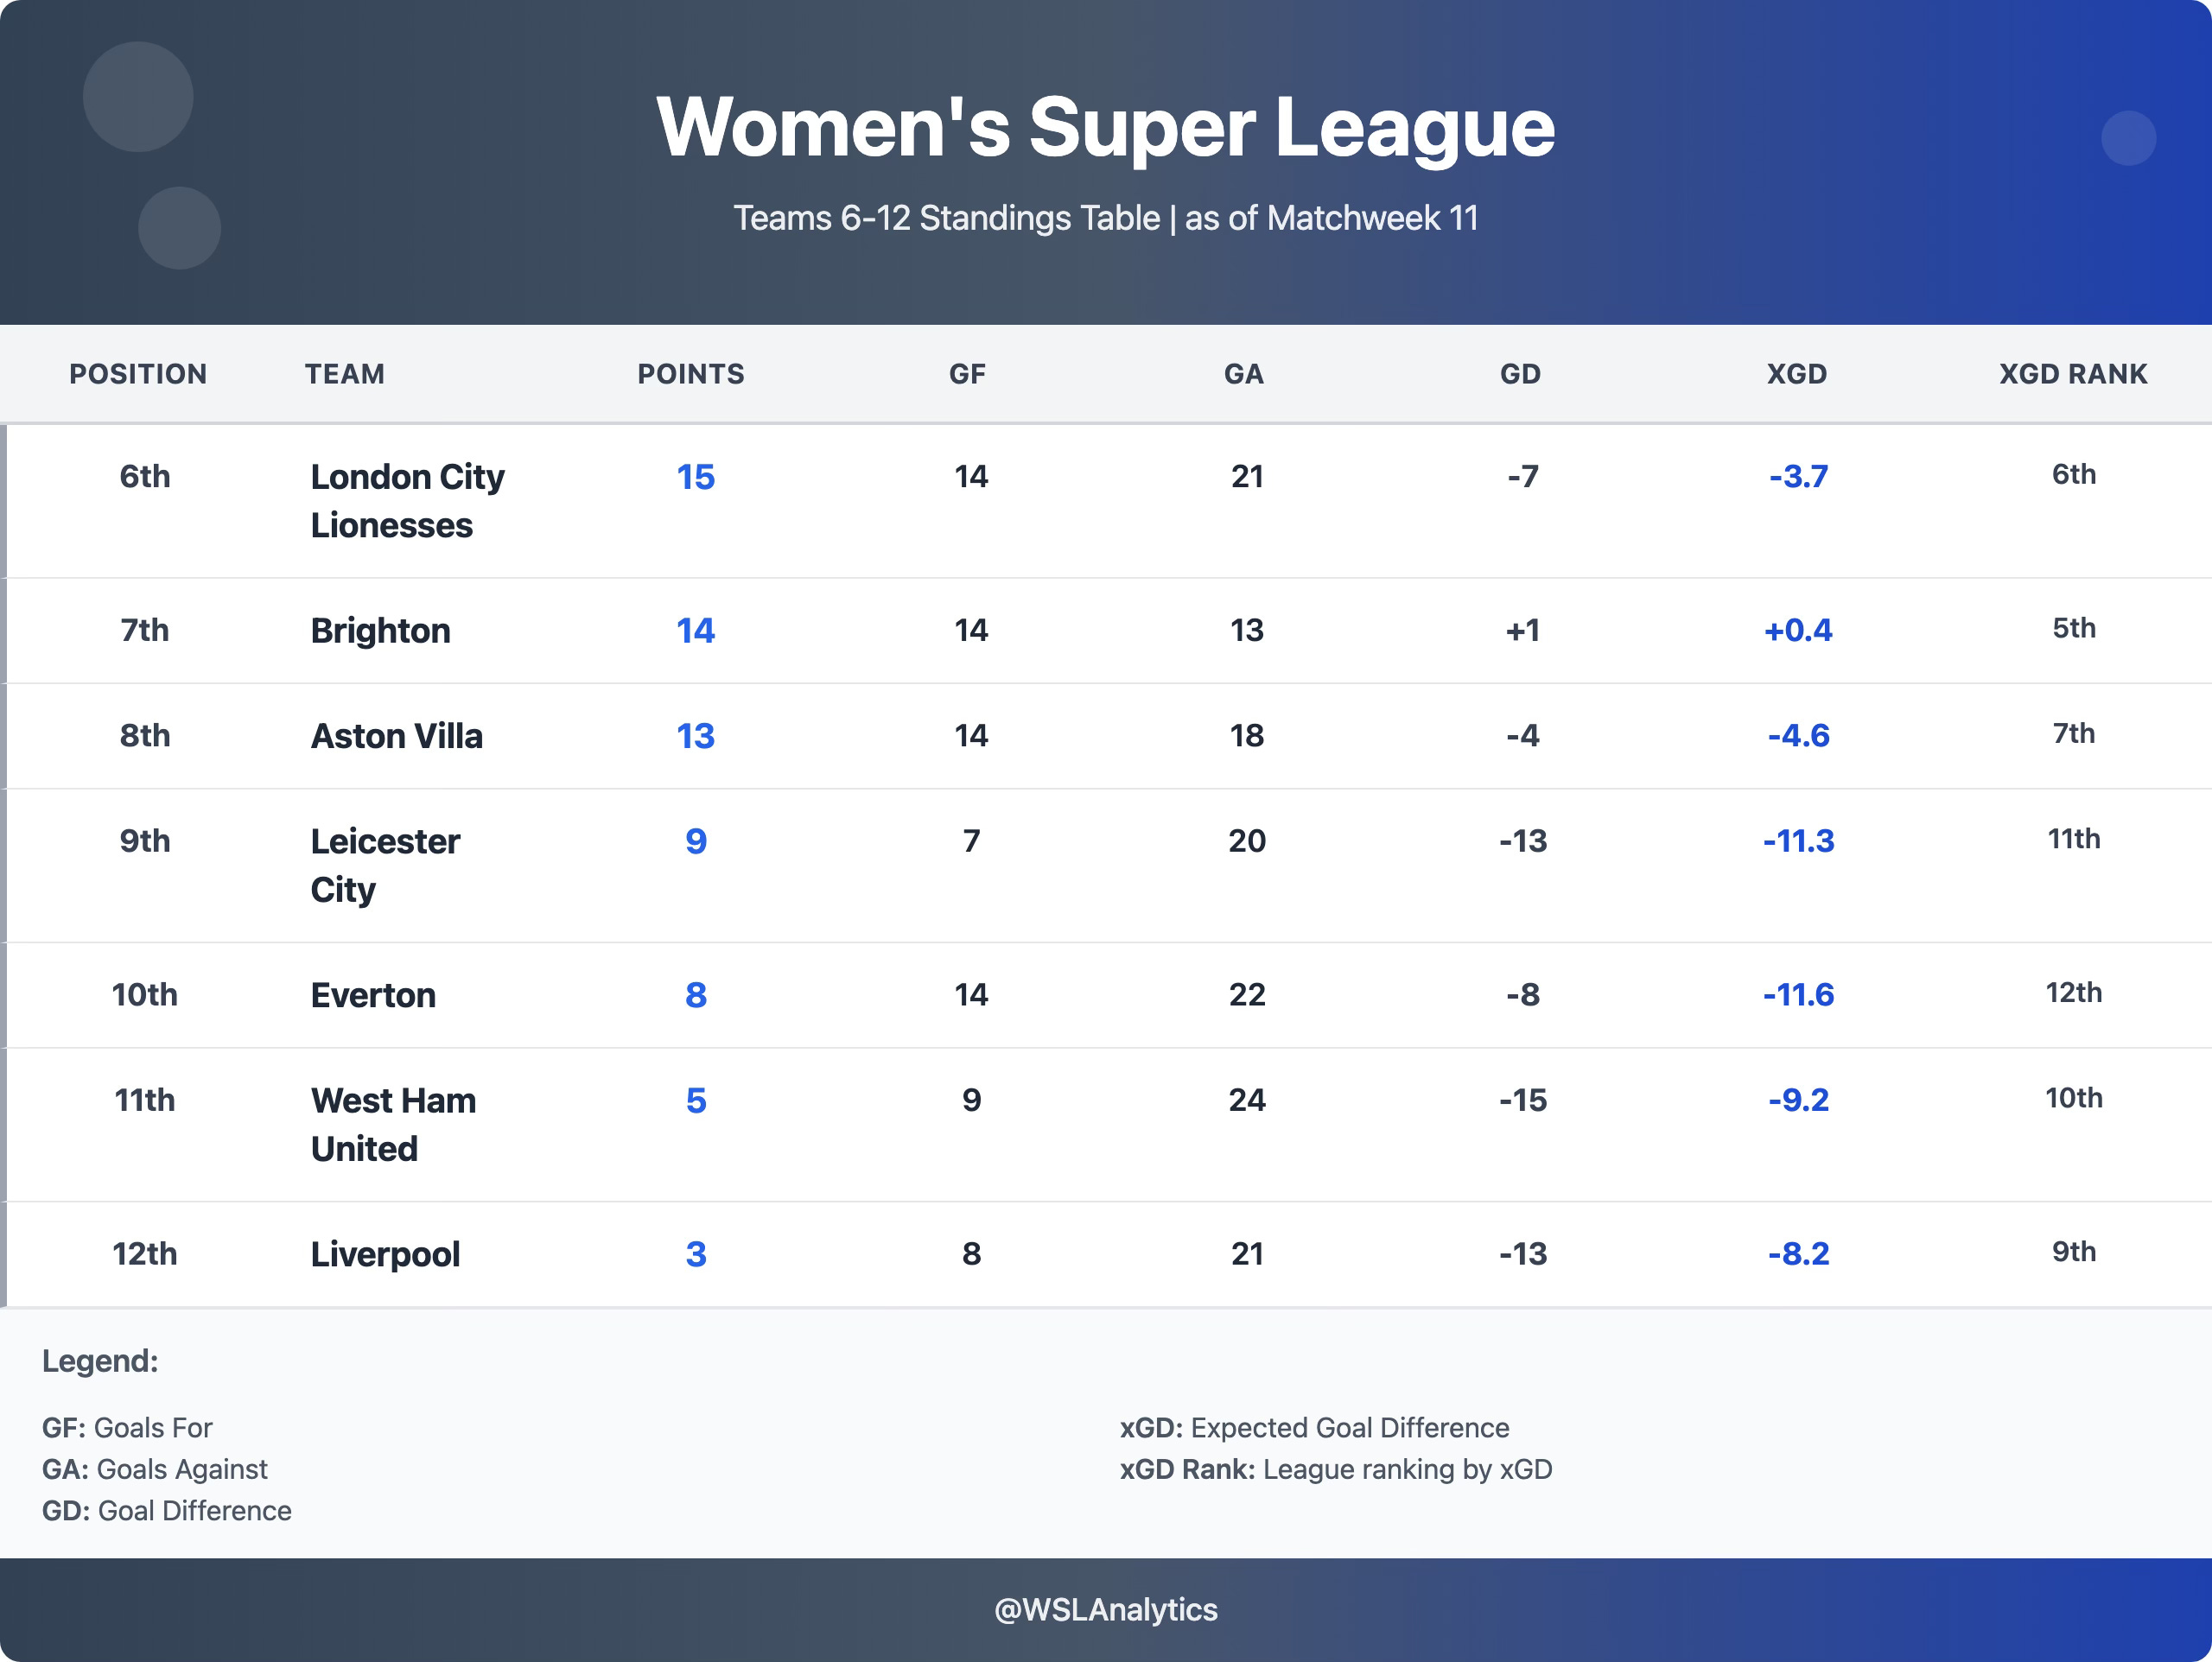
Teams 6-12 at the halfway mark: 12 points separate sixth from relegation playoff. Everton (-11.6 xGD, worst in division) sit 10th – results ahead of process. The bottom three are separated by just five points.
London City Lionesses – Ambition Without Limits (6th, 15 points)
London City arrived in the WSL with clear intent: this is not a “survive first, build later” project. After winning promotion in May 2025, they rebuilt extensively over the summer – nearly changing their entire squad with established internationals and headline signings under Michele Kang’s ownership.
That context is why the decision of the first half speaks volumes. On 21 December 2025, London City parted ways with head coach Jocelyn Prêcheur despite sitting 6th at the halfway point. The timing is revealing: most promoted teams would treat 6th as “job done”. London City treated it as a baseline.
Their record explains both promise and risk: 5W–0D–6L – an unusually binary profile that suggests bold game models but incomplete match management. The ability to secure a point when not at your best remains underdeveloped.
Performance metrics suggest box inefficiency: 14 goals from 15.8 xG (under-finishing) and 21 conceded from 19.5 xGA (over-conceding). That gap of 3.3 goals between actual (GD –7) and expected (xGD –3.7) represents the margins that turn competitive performances into volatile results.
The ambition signals are unmistakable. This is a club building for the top end of the league, not merely consolidating. The second half is less about relegation anxiety (they are 12 points clear of bottom) and more about converting ambition into stability. Small improvements in box margins and developing a draw-capable floor could keep them top-half. But if the managerial change disrupts cohesion, their all-or-nothing approach could cost them points rather than earning them.
Brighton & Hove Albion – Defensive Gains, Offensive Regression (7th, 14 points)
Brighton sit 7th with 14 points – a modest three-point drop from the 17 they held at this stage last season. The first-half profile looks like deliberate recalibration: They have become harder to score against (13 conceded versus 18 last year), but attacking output has dipped (14 scored versus 18). The question is whether this trade-off builds a sustainable platform or lowers their ceiling.
The underlying metrics suggest Brighton are delivering what their performances merit. Their +0.4 xGD aligns closely with their +1 goal difference, indicating no major distortion from luck. They’ve produced 15.2 xG and allowed 14.8 xGA – a balanced mid-table profile. The box margins are small but telling: 14 from 15.2 xG (92.1%) points to slight under-finishing, while 13 conceded from 14.8 xGA is marginally better than expected.
The defensive improvement shows up in its shape. Brighton have three clean sheets – the same as last season – so gains haven’t come from shutting teams out more often. Instead, they’ve reduced severity on concession days: averaging 1.63 goals against in non-clean-sheet matches versus 2.25 last season.
The tactical shift is evident in possession (down from 53.4% to 48.0%), suggesting less territorial dominance and more comfort without the ball. Interestingly, shot volume has risen slightly (11.5 per game versus 11.0), yet goals per game have fallen (1.27 from 1.64) – consistent with either shot-quality dilution or finishing variance. With 15.2 xG, the evidence leans towards finishing rather than creation collapsing.
Vidošić’s second-half challenge is precise: can Brighton add final-third efficiency without losing their defensive baseline? They sit one point behind London City (6th) and one ahead of Villa (8th). Small gains – one extra converted chance, one fewer two-goal concession – could meaningfully shift their season narrative.
Aston Villa – Building Under Arroyo (8th, 13 points)
Aston Villa’s 8th-place position tells only part of their story. Natalia Arroyo was appointed in January 2025 to steady a side drifting into a mid-season slump, and this campaign represents her first full pre-season to embed a clearer identity. At the halfway stage Villa have 13 points (up from 10 last year) – more stabilisation than step-change, but measurable improvement nonetheless.
The underlying numbers show results broadly aligned with performance. Villa’s –4.6 xGD sits close to their –4 goal difference, suggesting no major over- or under-performance. They’ve created 15.1 xG and conceded 19.7 xGA – a mid-table profile capable of producing chances but giving up too much defensively. Box margins tell the story: 14 goals from 15.1 xG (slight under-finishing) and 18 conceded from 19.7 xGA (marginally better than expected). Fine margins haven’t consistently fallen their way.
A tactical shift is evident in possession, dropping from 53.2% to 45.4% – a 7.8 percentage-point decline towards more direct, pragmatic play. Whether this represents Arroyo’s preferred style or transitional adaptation remains unclear, but it aligns with a manage-the-game-first approach prioritising stability.
Villa’s four draws capture their season: regularly competitive but not consistently decisive. They’re often in matches – organised enough to stay close, productive enough to create chances – yet 18 conceded and modest under-finishing means they’ve struggled converting level games into wins. The defensive volatility beneath the totals is revealing: five clean sheets yet 18 conceded suggests a binary performance profile. It’s worth noting that the goals-against figure is partly skewed by one heavy outlier – the 6–1 defeat at Manchester City – which inflates the headline number and reinforces the sense of inconsistency.
Finally, it is worth reframing expectations. Villa finished 6th last season, creating pressure to immediately look top-six again. Arroyo’s first full season is realistically about laying sustainable foundations. The second half will be judged on two indicators: reducing heavy concessions and improving final-third efficiency. With mid-table tightly packed, those small improvements separate a push towards 6th–7th from an uncomfortable lower-mid-table slide.
Leicester City – Marginal Gains, Structural Problems (9th, 9 points)
Leicester’s first half reads as modest progress from a very low base. On 9 points they’re three better off than at the same stage last season (6), and goal output has more than doubled – 7 scored now versus 3 after 11 games in 2024–25. On the surface, that looks like forward movement.
The underlying picture remains uncomfortable. Leicester are 2W–3D–6L and have conceded 20 goals – six more than last year’s 14 – leaving them with a –13 goal difference (worse than last season’s –11). The attacking gains have been neutralised by clear defensive deterioration.
Performance metrics confirm this isn’t bad luck. Leicester have created just 7.1 xG (lowest in the league) while allowing 18.5 xGA, producing a –11.3 xGD. Their actual –13 GD is slightly worse, driven by box margins: 7 goals from 7.1 xG represents neutral finishing, but 20 conceded from 18.5 xGA indicates worse-than-expected prevention – the kind of swing that turns tight losses into damaging ones when your attack is already minimal.
The tactical profile reflects structural issues: 7.3 shots per game (the 2nd lowest in the division) and 36.1% possession keeps them in reactive mode. Limited territory, limited pressure, and a defensive unit asked to absorb too much for too long. Marginal improvements (shots up 0.5 year-on-year) are nowhere near enough to shift match balance.
Rick Passmoor’s second-half challenge is clear: can Leicester stabilise defensively without reverting to last season’s attacking sterility? At 9 points they’re not in freefall, but the cushion is thin – one point above Everton and four above West Ham. The task is simple to state but difficult to execute: raise the attacking floor slightly while reducing the concede-two baseline that makes every match feel like a climb.
Everton – The Paradox of Improved Attack, Worsening Results (10th, 8 points)
Everton’s first half presents a genuine contradiction: goal output has surged, yet results have deteriorated. They’ve scored 14 goals – exactly double last season’s 7 – but have only 8 points, down from 10. In a league this tight at the bottom, that’s a worrying trade.
The explanation sits almost entirely in defensive regression. Everton have conceded 22 goals (up from 17), pushing goals conceded per game from 1.55 to 2.00. The extra goals against have erased improved scoring benefits, leaving them with a –8 goal difference and a more fragile week-to-week profile.
Even so, Everton have shown a real ceiling – the 1–0 win away at Chelsea on 7 December, ending Chelsea’s 34-match unbeaten WSL run – but it also underlined how fine their margins are when they create so little and still have to survive long spells without the ball.
The underlying metrics reinforce concern. Everton’s 20.6 xGA ranks second-worst in the league – they’re allowing high-quality chances too frequently. Conceding 22 from 20.6 xGA is only marginally worse than expected, but the baseline itself is very poor.
At the other end, the improvement is built on shaky ground. Everton have generated just 9.0 xG yet scored 14 goals – a 155.6% finishing efficiency. That isn’t sustainable. This explains the paradox: Everton haven’t become a high-chance team, they’ve become a high-conversion team while defensive process has worsened.
Control indicators support the same story: 8.5 shots per game (3rd lowest in the league) and 44.5% possession (again, 3rd lowest) means no sustained pressure. They’re relying on clinical execution of limited attacking volume while being repeatedly exposed defensively.
For Brian Sørensen, the second half comes down to sequencing. If finishing regresses towards xG – the normal pattern over time – survival depends almost entirely on reducing chance quality and frequency conceded. At 10th on 8 points, only three above West Ham and five above Liverpool, with a relegation play-off in the picture, Everton cannot afford the goals drying up before the defending improves.
West Ham United – Crisis Mode at the Bottom (11th, 5 points)
West Ham’s first half has been disastrous enough to cost Rehanne Skinner her job. Sitting 11th (second-bottom) with 5 points from 11 matches (1W–2D–8L), the club moved decisively rather than wait for a turnaround that never arrived.
The defensive crisis provides the clearest justification. West Ham have conceded 24 goals at the halfway stage – identical to last season’s 24 – and goals conceded per game remains stuck at 2.18. More critically, the process supports the outcome: 21.2 xGA confirms they’re routinely allowing high-quality chances, and conceding 24 from that figure shows slightly worse-than-expected prevention.
The attacking regression sealed Skinner’s fate. West Ham have scored just 9 goals, down from 12 last season, despite increased activity: shots per game up to 12.0 from 10.4, possession ticked up to 43.2%. Yet output has declined because execution collapsed. With 12.0 xG, West Ham should be around 12 goals; converting 9 from 12.0 xG (75%) compounds defensive fragility.
That dual-box problem is why the table looks worse than underlying performance. West Ham’s –9.2 xGD already describes a struggling team, but their actual –15 goal difference represents a –5.8 gap driven by inefficiency at both ends. They’re losing fine margins and big margins.
The second half becomes a race against format as much as table. West Ham sit just two points above Liverpool. The bottom WSL side this season faces a promotion/relegation play-off against third in WSL2. One poor run could push West Ham into 12th, reducing the entire season to a single high-stakes fixture. The new head coach inherits low confidence, porous defending, and blunt finishing – problems requiring quick improvement, not gradual change.
Liverpool – Winless and Bottom: A Full-Scale Crisis (12th, 3 points)
Liverpool’s first half represents the worst performance in the league. Bottom with 3 points from 11 matches and winless (0W–3D–8L), this is a season-defining collapse that has put their WSL status at genuine risk, with the 12th-placed side facing a promotion/relegation play-off against third in WSL2.
The regression from last season is stark. At this stage in 2024–25, Liverpool had 12 points (3W–3D–5L). They now have 3 – a 9-point decline, the largest year-on-year drop in the division. In twelve months, they’ve moved from lower-mid-table stability to outright crisis.
The attack shows signs of systemic failure. Their shot volume has dropped from 11.0 per game last season to 6.4 this year – lowest in the division – indicating a struggle to generate even basic attacking moments. The expected-goals profile is equally bleak: 8.0 xG in 11 matches (0.73 per game). They’ve scored 8 from that – essentially in line with expectation – but this only underlines the problem: even clinical finishing cannot rescue a team whose chance-creation ceiling is barely one goal per game. Even more worrying is how concentrated that output is: Beata Olsson has scored five of Liverpool’s eight WSL goals (62.5%) – remove her and Liverpool have just three league goals – a dangerous over-reliance on a single player.
Defensively, the situation is also alarming because the gap is so large. Liverpool have conceded 21 goals from 16.2 xGA, a –4.8 differential pointing to repeated high-impact failures – whether shot-stopping, individual errors, or set-piece breakdowns. The result is a –13 goal difference materially worse than their –8.2 xGD baseline.
The profile is clear: 47.5% possession isn’t translating into threat, and the collapsed shot volume means Liverpool cannot impose themselves or create comeback pathways once behind. The second half is about survival, nothing more. Liverpool sit bottom on 3 points, two behind West Ham. The route out requires more than incremental improvement – they need a step-change in chance generation and a sharp reduction in preventable concessions.
The Verdict: Fine Margins and Desperate Battles
The middle and bottom of the WSL table tells a story of fine margins and fragile foundations. London City, Brighton, Villa, and Leicester are separated by just six points – a gap small enough that three results could reshape the mid-table picture. But the process table complicates the surface narrative: Brighton’s +0.4 xGD and 5th-place xGD rank suggests a stronger platform than their league position, while Everton’s –11.6 xGD and 12th-place xGD rank highlights just how fragile their current points total is.
At the bottom, the battle is defined by different forms of unsustainability. Everton’s 155.6% finishing efficiency is the season’s loudest regression warning – survival depends on fixing the defensive process before the goals dry up. West Ham’s dual-box failure (a –5.8 gap between GD and xGD) cost their manager and now demands immediate improvement. Liverpool’s attacking collapse (6.4 shots per game, 0.73 xG per match) is the division’s most urgent crisis – winless, bottom, and relying on a transformation rather than a tweak.
The second half will ruthlessly expose which teams have genuine foundations and which are built on sand. With only the 12th-placed side facing the play-off, every point matters – and for the two clubs currently occupying the bottom two, the margin between WSL football and a single high-stakes fixture is measured in improvements they have not yet shown they can reliably make.
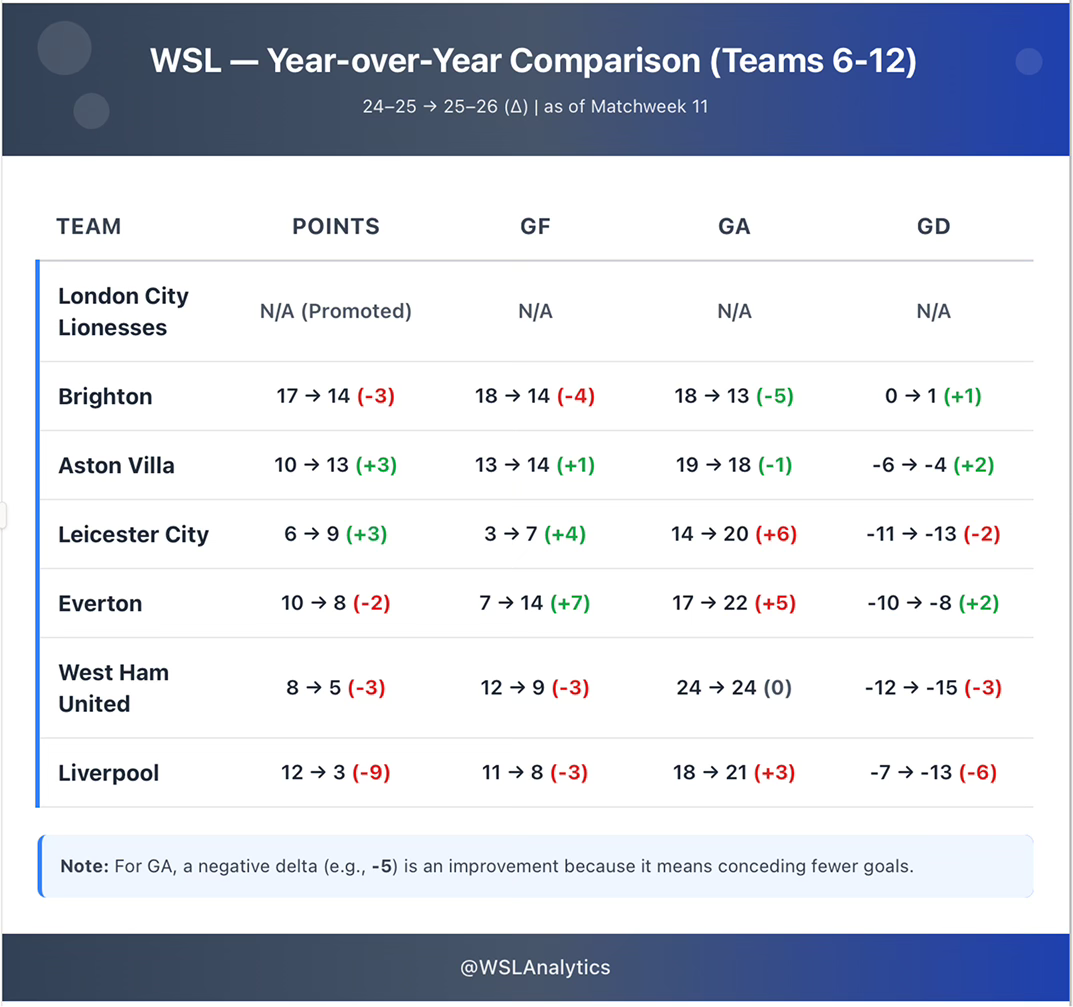
Year-over-year comparison highlights three defining swings in the bottom half: Everton’s attack surge (+7 GF), Liverpool’s points collapse (–9 points), and Brighton’s defensive reset (–5 GA).
Data & methodology
All figures are WSL league matches only, through Matchweek 11 (11 matches per team; 66 matches total). Team and player statistics are compiled primarily from FotMob, with club match reports used to verify specific match details where needed.
Coming next: In Part 3, we’ll explore league-wide tactical trends – from the finishing crisis affecting teams across the table to pressing intensity variations and set-piece threats that have become crucial differentiators in this season’s unpredictable WSL landscape.