
State of the League Report – Part 1: WSL 2025–26 Title Race – The Contenders
Chelsea remain unbeaten, City’s metrics surge, and United’s efficiency keeps them close – a three-way battle defined by fine margins and evolving identities.


Executive Summary
The 2025–26 Barclays Women’s Super League title race is shaping up to be the most competitive in recent years. After six rounds, no team has a perfect record – a sharp contrast to Chelsea’s flawless 18-point start last season. The traditional powerhouses remain near the top, but their grip is loosening: the top three sides are separated by just two points, and tactical evolution across the league has reshuffled the hierarchy.
With the international break providing a natural pause, it’s the ideal moment to take stock. Using a data-first approach, we assess each club across four dimensions – attacking efficiency, defensive solidity, pressing/possession profile, and overall trends. We compare this season to the same stage in 2024–25 team-by-team, spotlighting where sides have improved or regressed, then close with league-wide patterns shaping the early-season narrative.
Key Headlines:
Chelsea lead but scoring 43% fewer goals than last season’s blistering start
Manchester City have transformed into the league’s most potent attack under new management
Manchester United emerge as genuine title contenders with near-perfect balance
Tottenham’s defensive revolution propels them into top-four contention
Arsenal recover from last year’s sluggish beginning
London City Lionesses exceed all expectations in their WSL debut
The Current Landscape
Chelsea dominated early last season with 21 goals in six games, this year’s title race features multiple contenders sharing the scoring load. The gap between first and fifth has compressed from nine points to just five – a testament to the league’s evolving competitiveness.
Team-by-Team Performance Breakdown
The Contenders
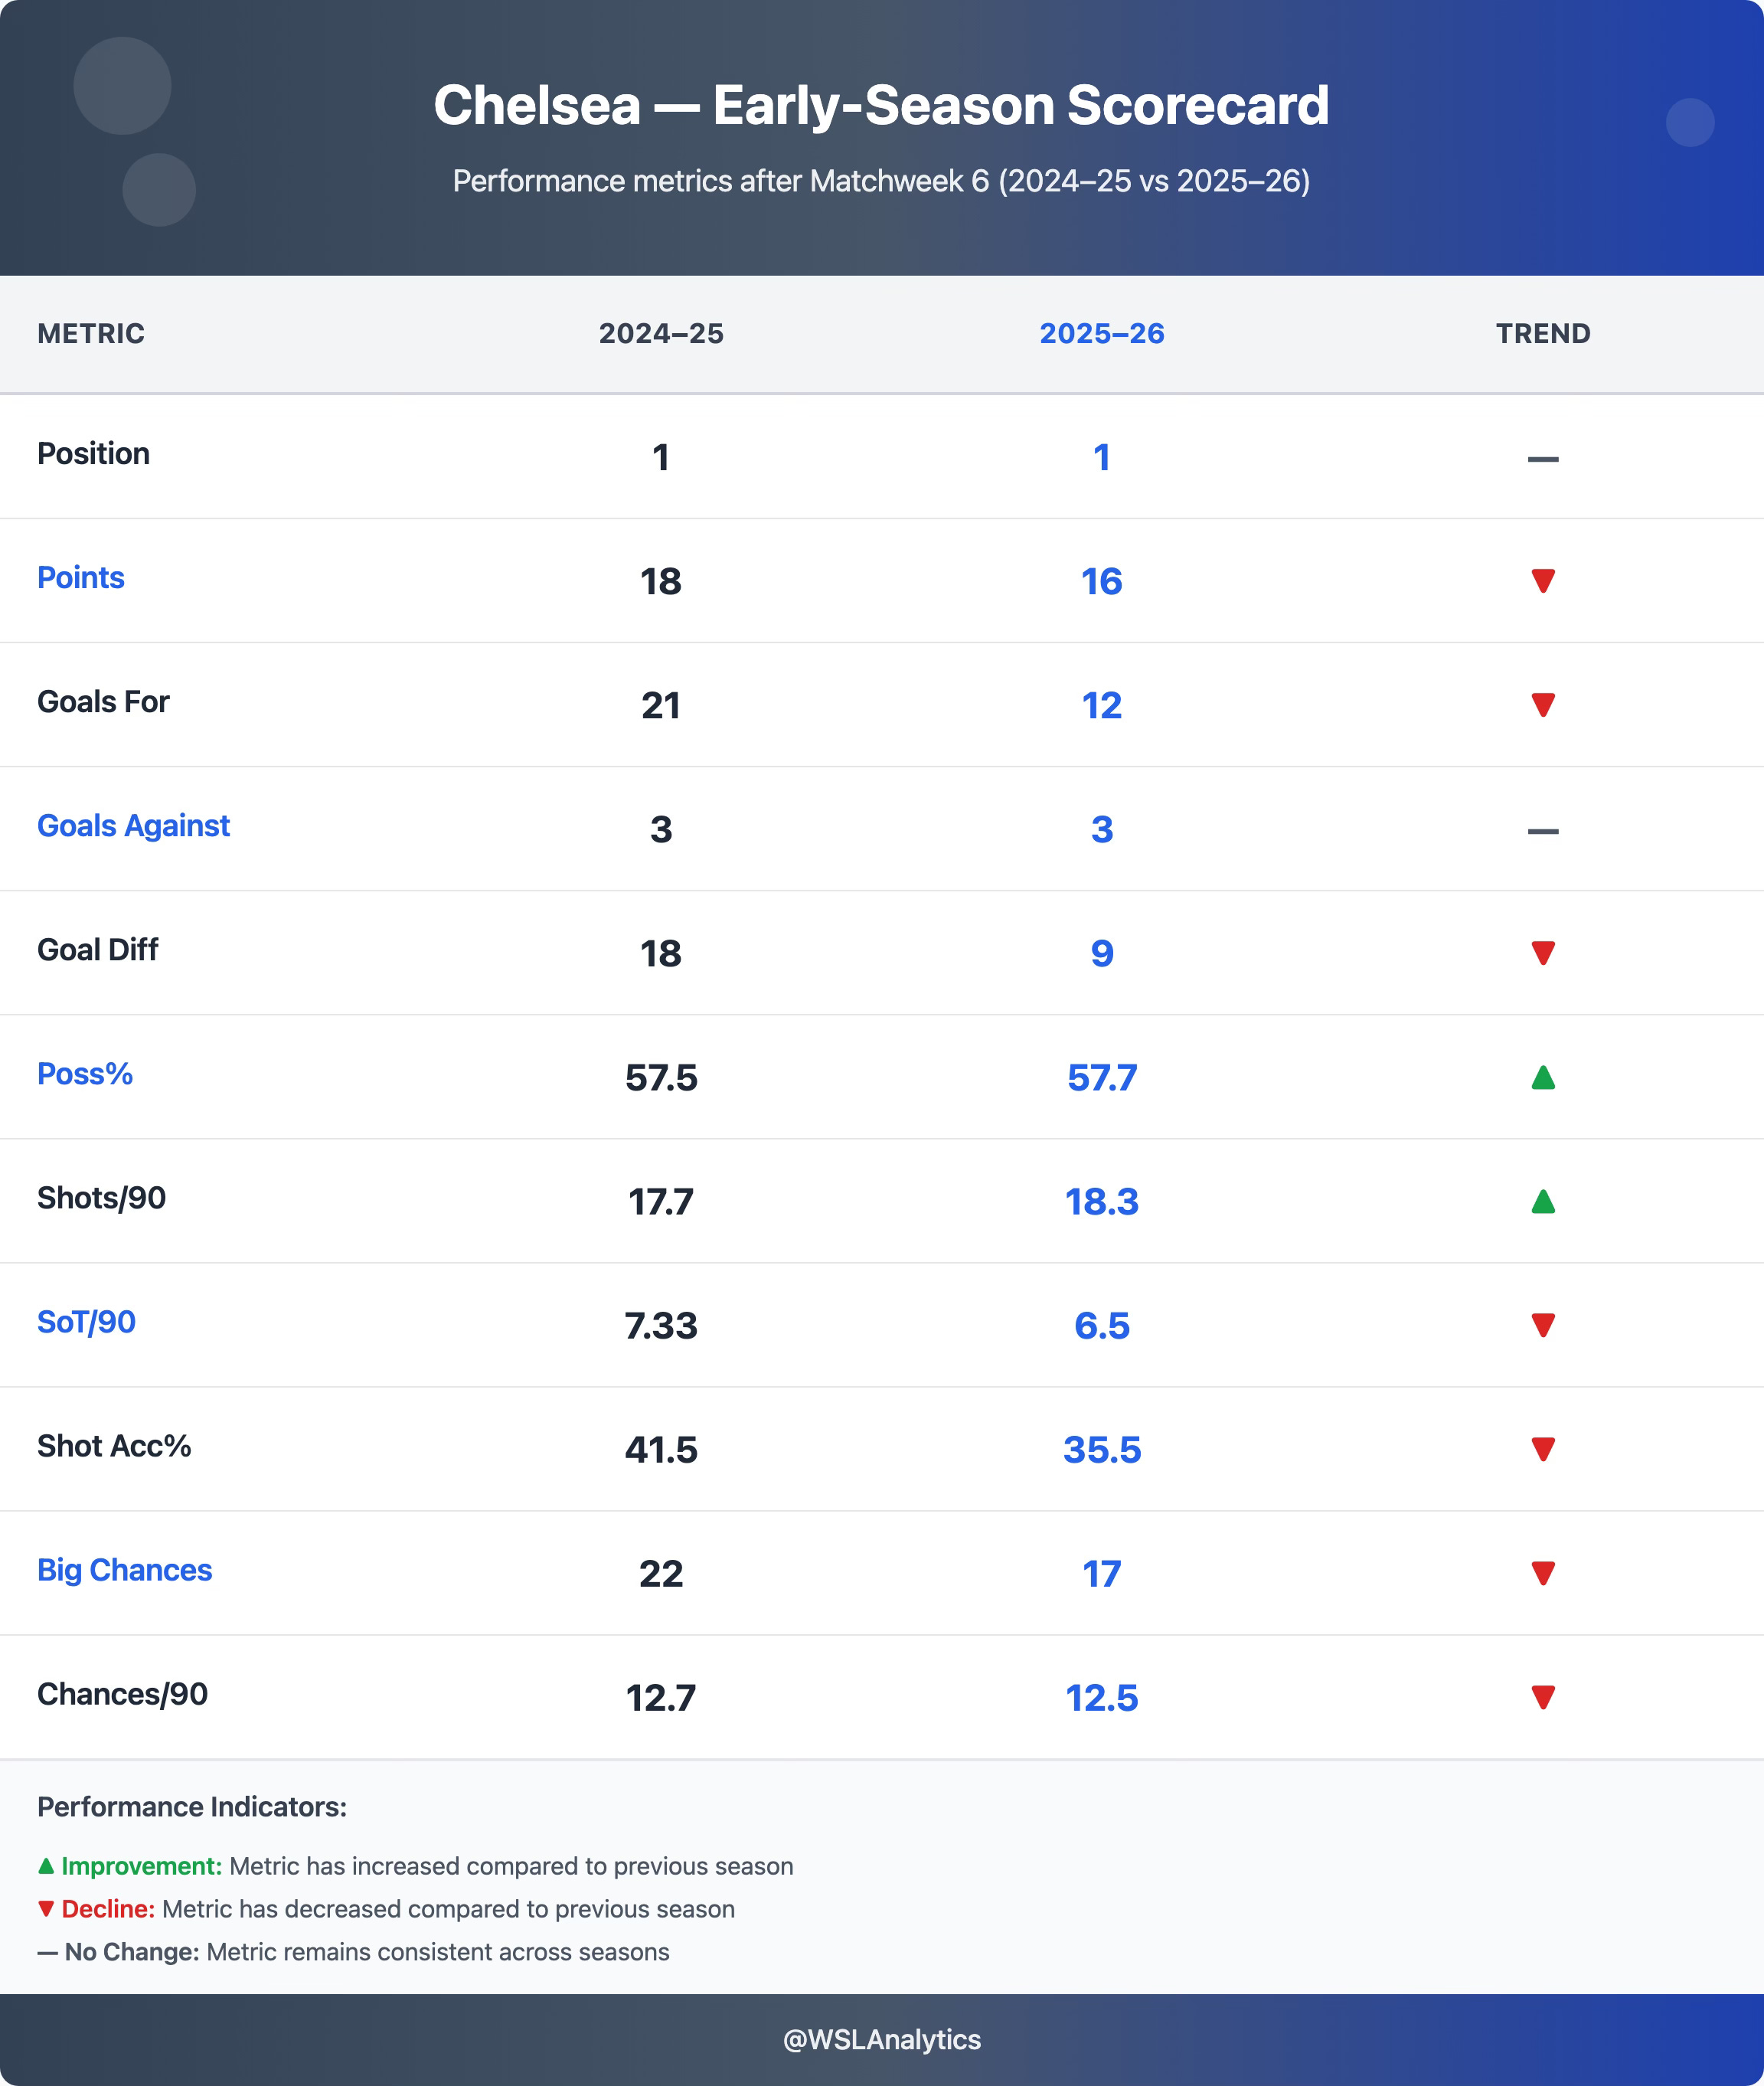
Chelsea (1st in 2024-25, 1st in 2025-26)
Still unbeaten, still ruthless, but no longer untouchable.
Chelsea have started strong again, topping the table, but their dominance is slightly less emphatic than last year. After six games in 2024-25 they were a perfect 6-0-0 with 18 points, scoring a remarkable 21 goals. This season they remain unbeaten (5-1-0, 16 points) but have scored only 12 goals in the same period – a 43% drop in output.
The attack is still creating plenty of chances (110 shots, 75 chances created so far) but a lack of clinical finishing has been evident. Shot accuracy has slipped from 41.5% to 35.5% (–14%), and big chances are down 22 → 17 (–23%), indicating fewer high-value opportunities. They’re attempting as much (or more) but yielding fewer goals – an efficiency issue rather than a creation one.
Chelsea’s defensive base remains intact across both seasons. They’ve conceded 3 goals in six games again, matching last year’s record, while the goal difference has halved (+18 → +9, –50%) – a shift driven entirely by reduced scoring rather than defensive slippage. Clean-sheet rate is steady, underscoring a unit that continues to rank among the league’s most secure; the year-on-year data points to continuity, structure, and reliability at the back.
Chelsea’s possession profile is essentially unchanged year-on-year. Possession ticks up from 57.5% to 57.7% (+0.2 percentage points (pp)), reinforcing similar control of matches, while chances per 90 ease from 12.7 to 12.5 (–2%), indicating creation levels are broadly stable. The underlying structure is consistent: high possession, controlled tempo, and low-risk transitions rather than a radical tactical shift.
Data verdict: Chelsea’s model remains elite defensively, but attacking efficiency has dropped by ~40%. If finishing returns to 2024-25 levels, performance metrics project a similar points trajectory by mid-season.
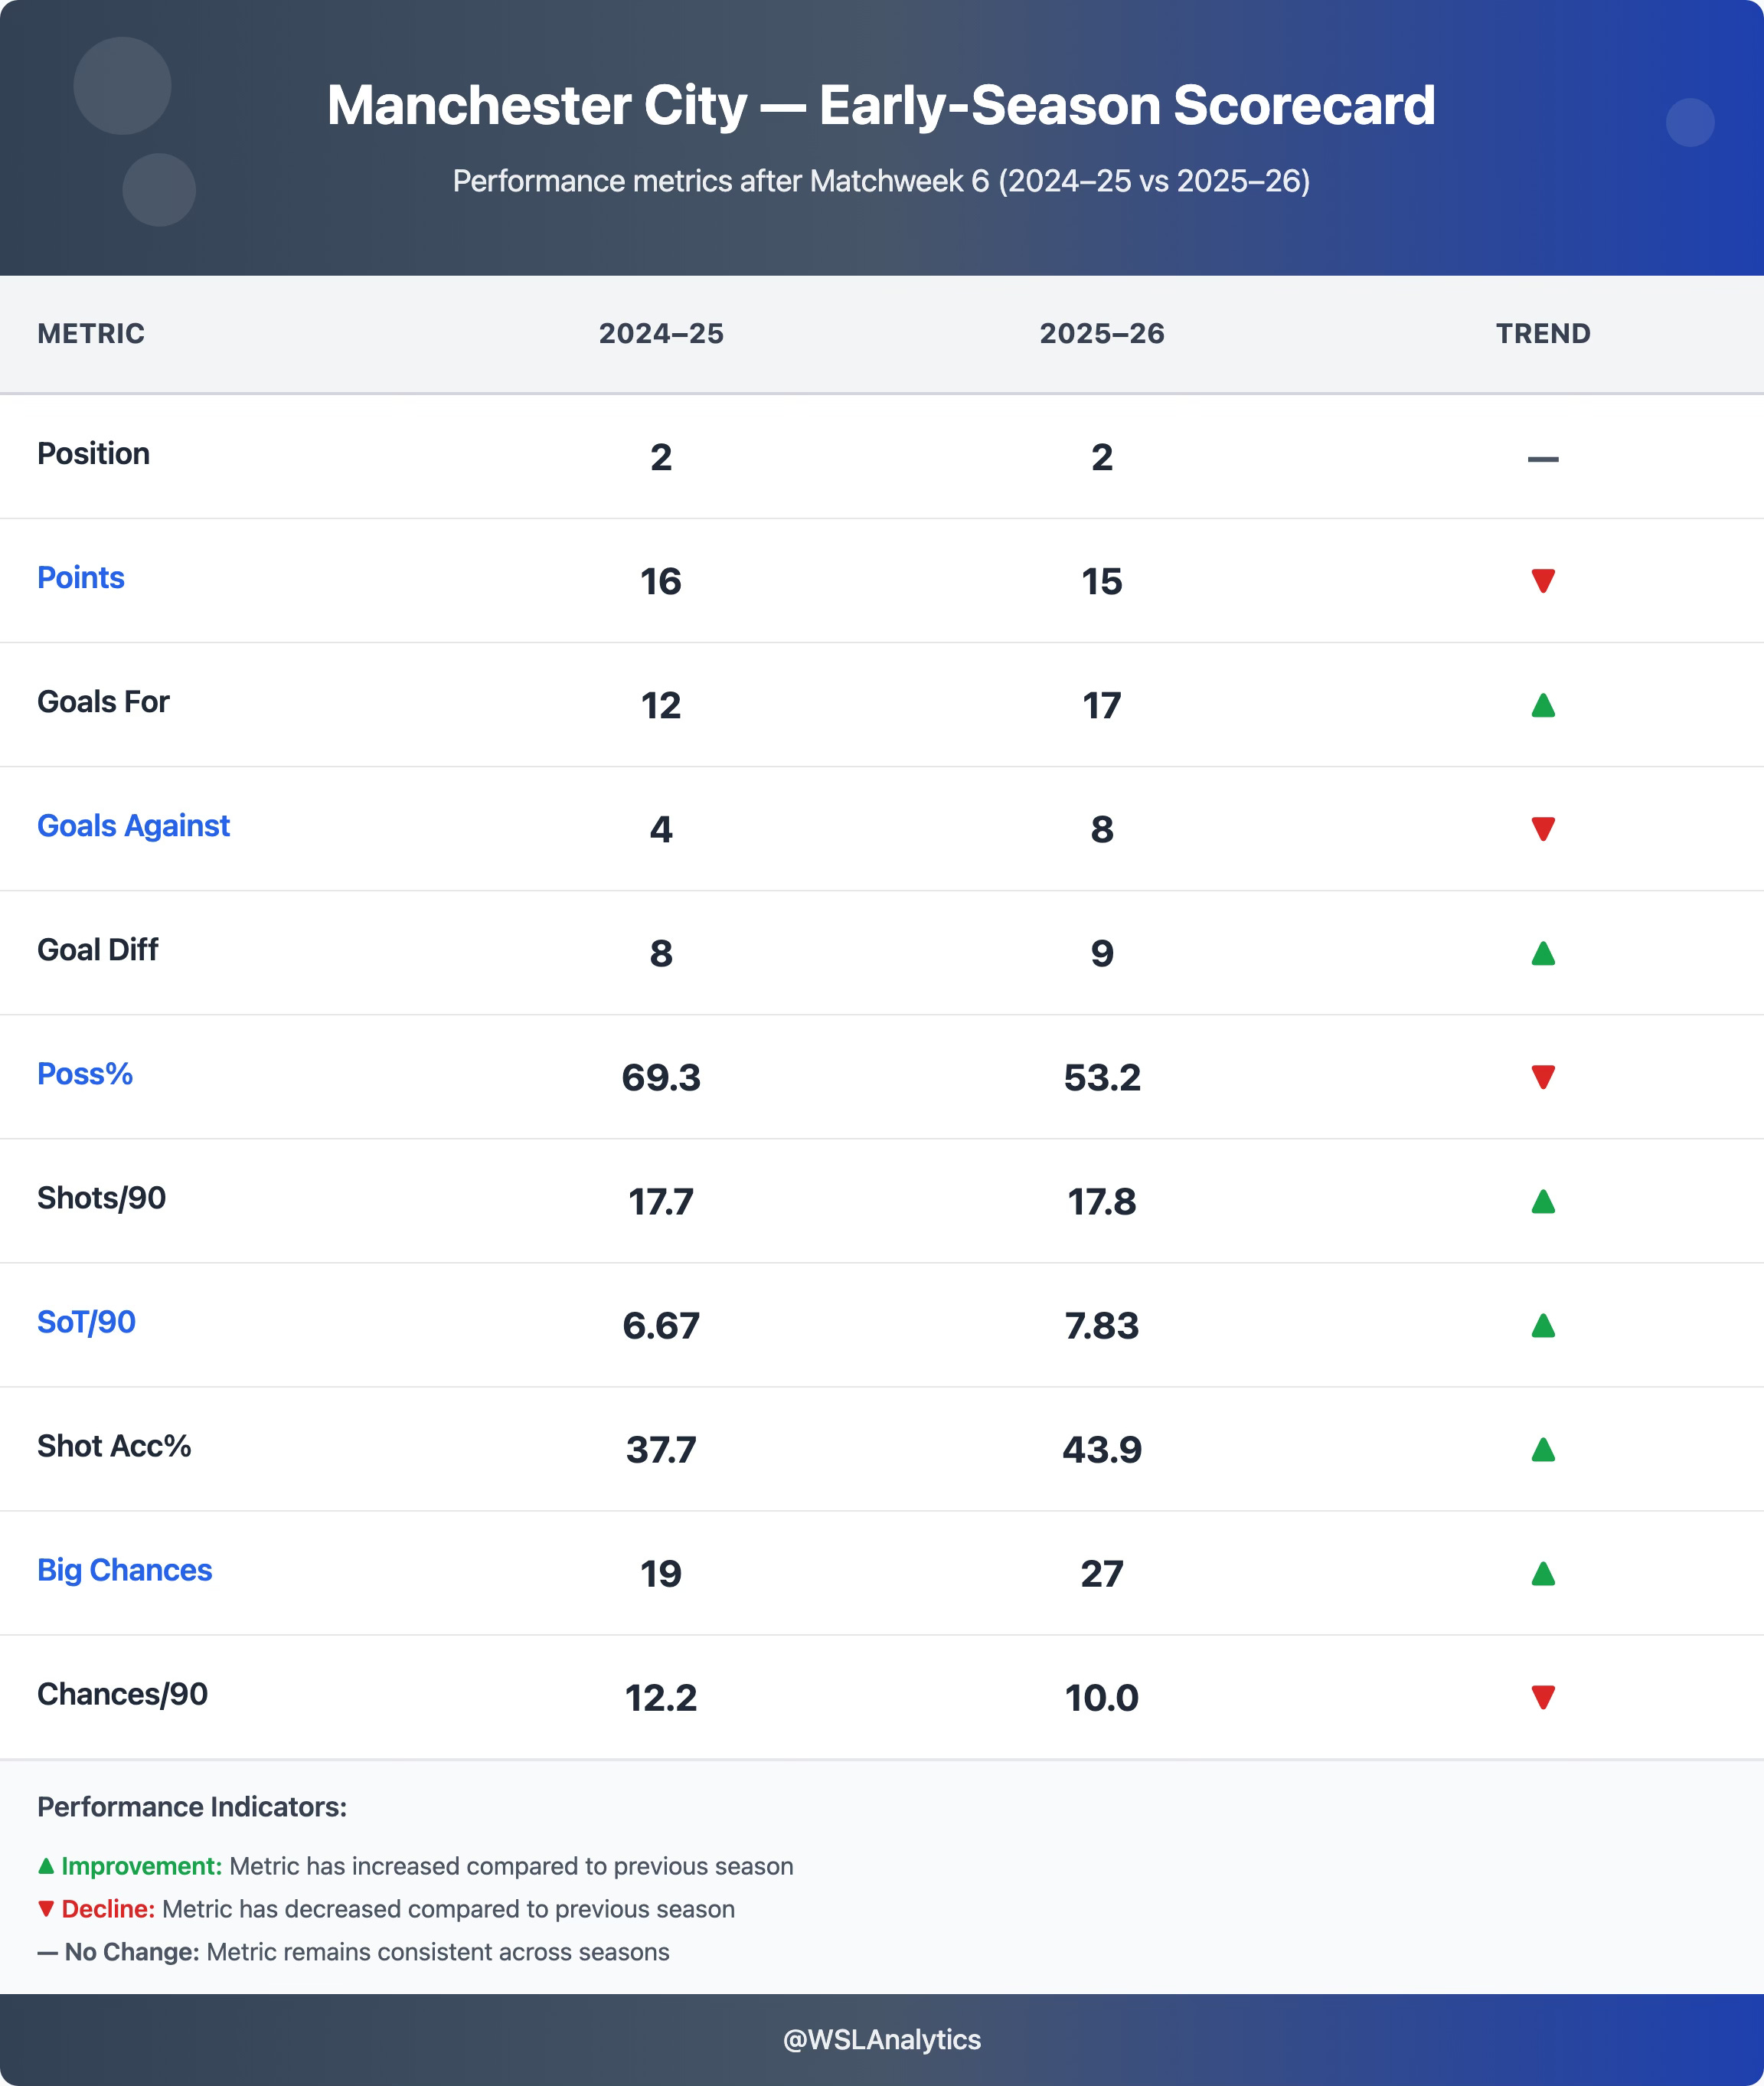
Manchester City (2nd in 2024-25, 2nd in 2025-26)
Sharper edge up front, looser grip at the back.
Manchester City have undergone a noticeable transformation in style and output. After six games last season, City had a possession-heavy approach (league-high ~69% possession) but a relatively modest 12 goals scored. This year, under new coach Andrée Jeglertz, City appear more direct and incisive – their goals have jumped to a league-leading 17, despite average possession falling to about 53%.
The data suggests City are now creating higher-quality chances rather than simply dominating the ball: they have racked up 27 “big chances” in six games, the most in the league, up from 19 at this stage last year. Their total shots (107) and shots on target (47) are among the highest, indicating a very aggressive attack.
City’s willingness to cede some possession has not hurt their attack – if anything, they are more efficient, with quick transitions catching opponents off guard.
On the defensive side, however, City have shown a bit more vulnerability: 8 goals conceded vs 4 by this point last season. They’ve kept only one clean sheet so far. While the defence isn’t as airtight, City’s increased goal output means they still boast a +9 goal difference and remain just one point off the top.
Data verdict: City have traded some control for punch. The attack is hotter (more big chances, better accuracy) while the defence is more permissive. If they can tighten defensively, this evolution positions them as Chelsea’s primary title threat.
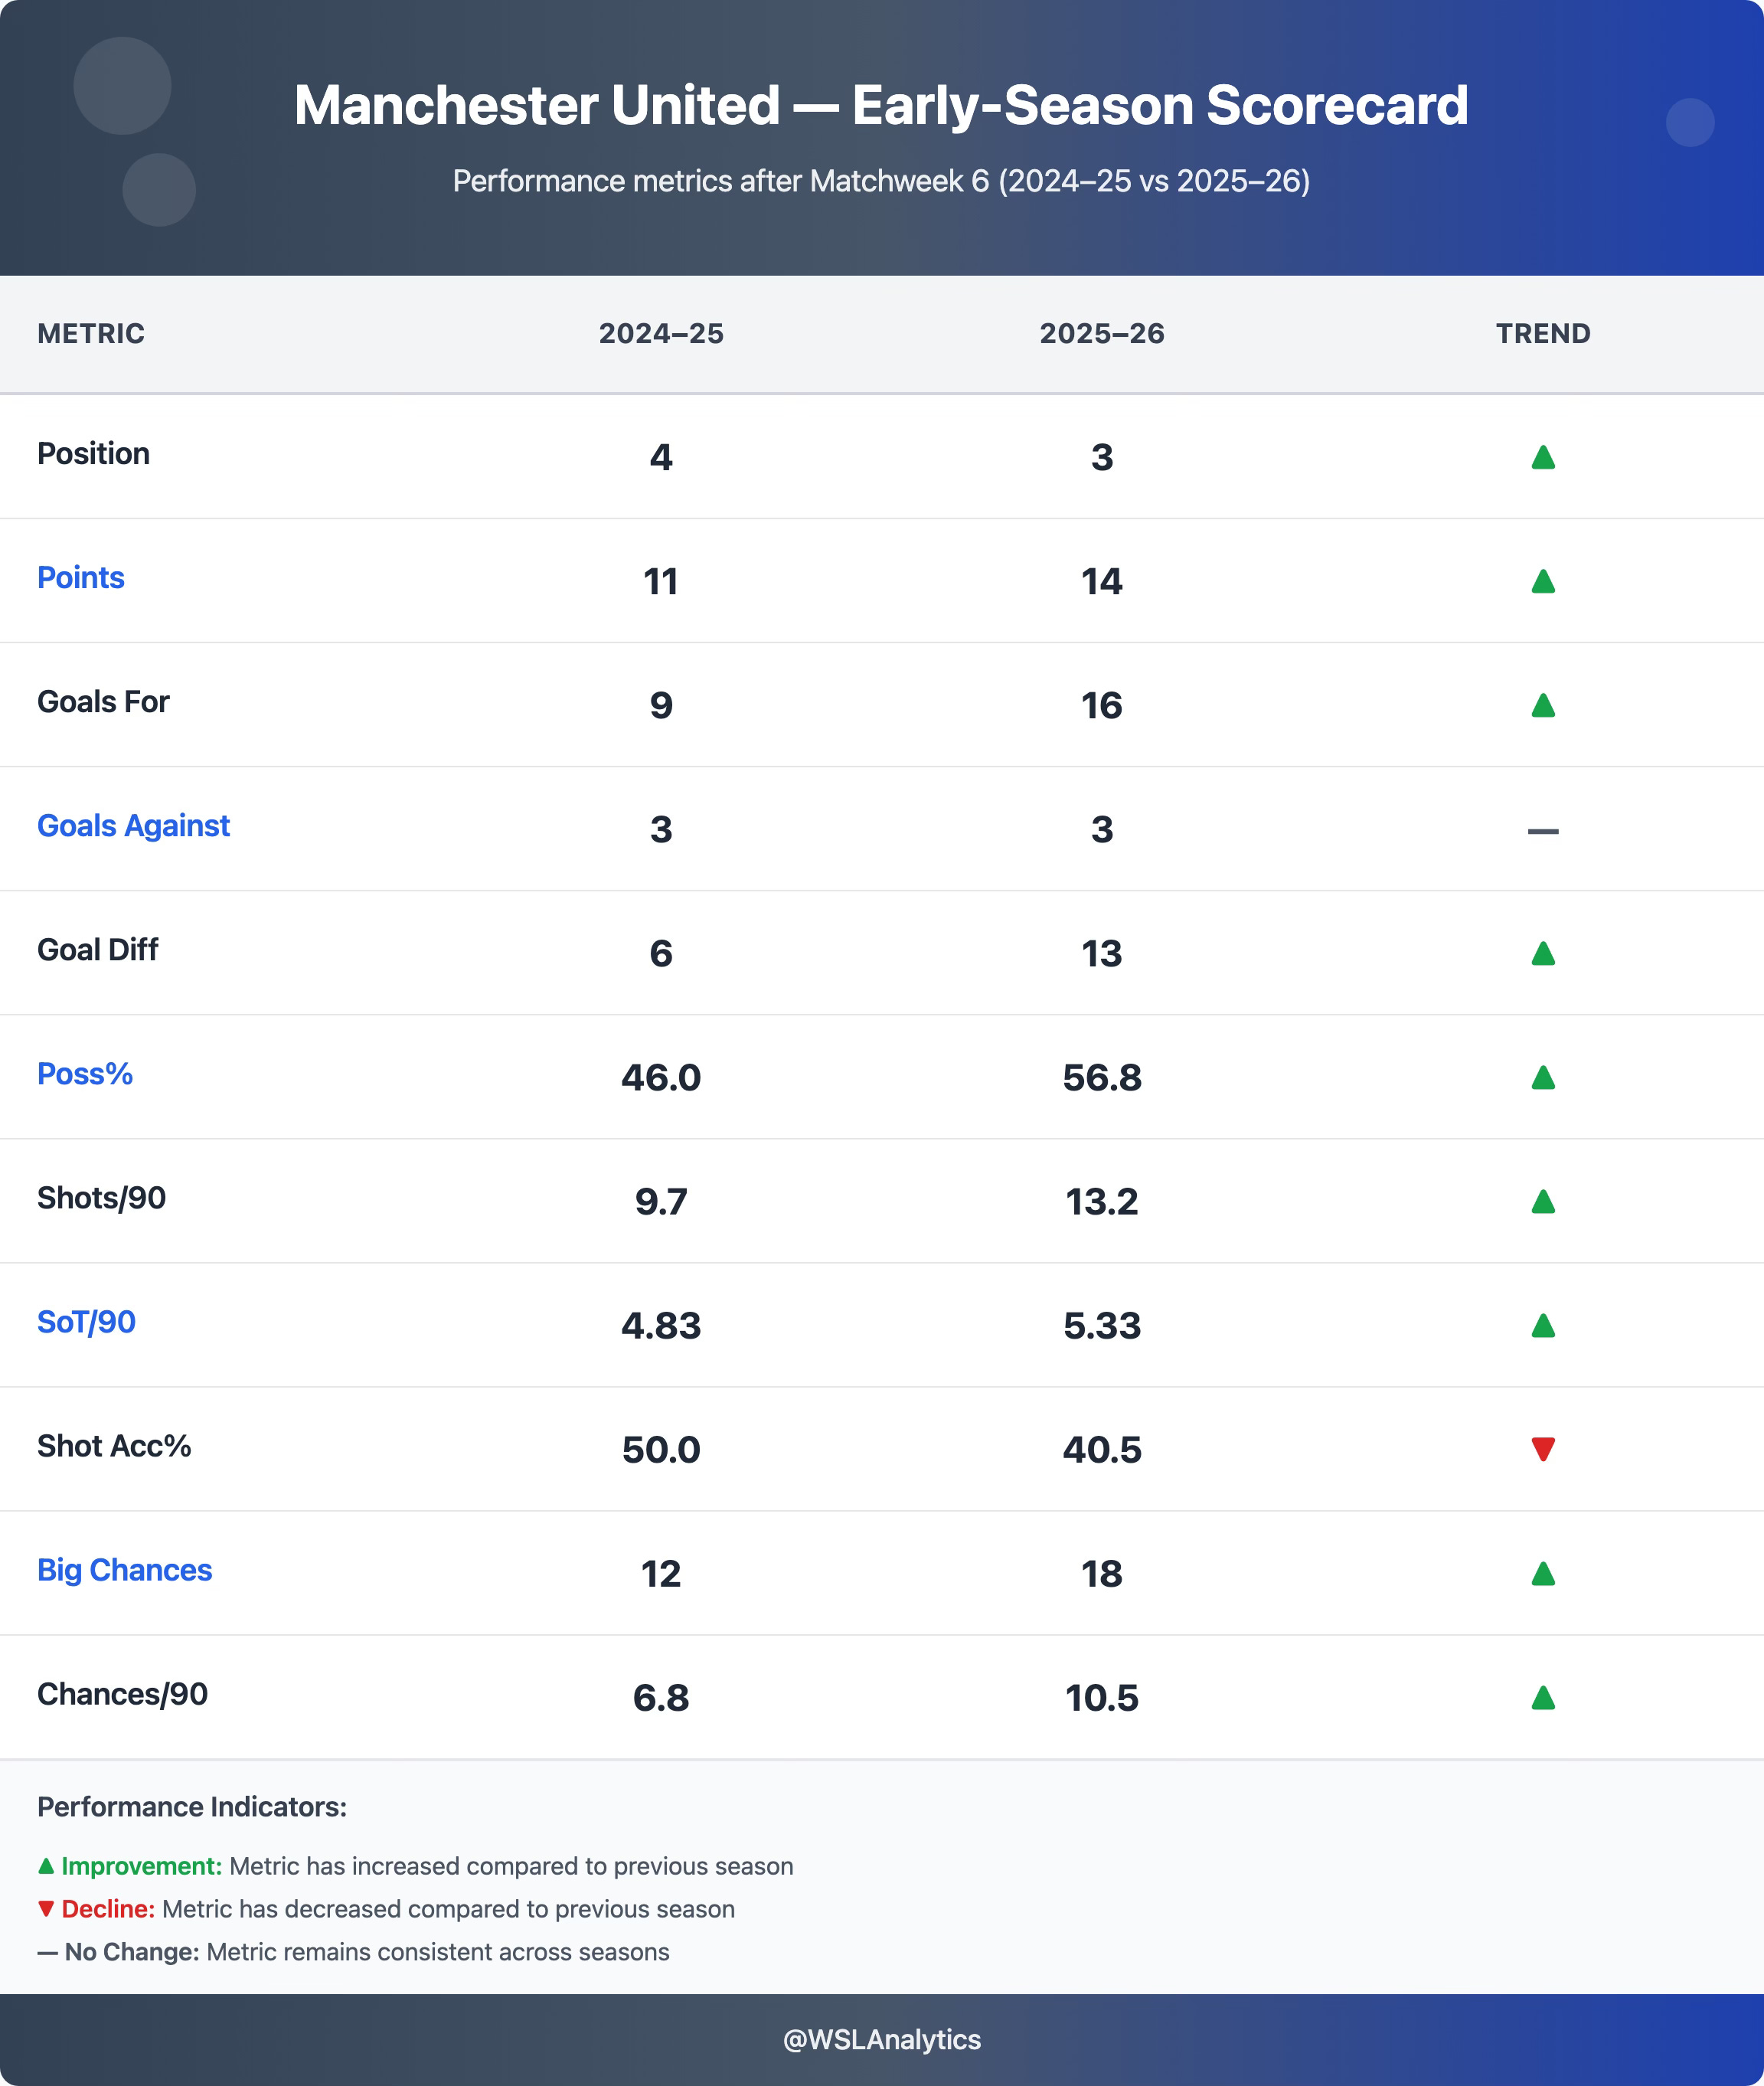
Manchester United (4th in 2024–25, 3rd in 2025–26)
Sharper, more possession-heavy attack; defence steady, ceiling rising.
Manchester United have made significant strides in 2025-26, improving in both attack and control of games. They’ve jumped from 11 points to 14 points, remaining unbeaten (4-2-0) and rising to third place. United’s goals scored have nearly doubled – 16 this season vs 9 at the same stage last year – reflecting a more potent attack.
Attacking shift and output jump. Volume is up across the board: shots 58 → 79 (+36%), chances created 41 → 63 (+54%), and big chances 12 → 18 (+50%). The only drag is shot accuracy, which has dipped from 50.0% → 40.5% (–9.5 pp). In short: they’re creating much more and from better locations.
Another stark change is in United’s possession and control. They now average 56.8% possession (up from just 46.0% at this stage last season), indicating a more proactive, pressing approach to win and keep the ball. What’s even more remarkable is that this shift has not come at the cost of their defence.
Defensive baseline intact. Goals against remain 3 → 3 (no change), indicating the back line hasn’t loosened despite the attacking ramp-up. The improved scoring has therefore translated directly into a much healthier goal difference: +6 → +13 (+117%). If the defence maintains this concession rate while the attack holds its current chance quality, United’s points floor rises.
Data verdict: United look materially stronger: more of the ball, many more chances, and a stable defence. The only warning light is finishing efficiency (lower shot accuracy). If conversion normalises towards last year’s precision while chance volume stays elevated, United are projected to outpace last season’s trajectory and push the top two deeper into the autumn.
Title Race Outlook – What Decides It from Here
Chelsea remain the standard-setters in resilience and mentality, but their attacking edge has dulled.
Manchester City look the most complete side on process and chance creation – although a little vulnerable on the defensive side of things, which they need to address.
Manchester United, meanwhile, look like a well-oiled machine. Efficient and organised, though their underlying numbers suggest fine margins rather than dominance.
The title picture is far from settled. With just two points separating the trio, every dropped result carries weight – and the next few matchweeks could swing momentum decisively.
Next: In Part 2 of our State of the League Report, attention will shift to the rest of the league – Tottenham’s resurgence, Arsenal’s uneven rhythm, and the mid-table sides whose volatility could yet reshape the race for Europe and survival alike.
If this breakdown was useful, please consider subscribing and sharing – and join the conversation on X (Twitter) @WSLAnalytics for live WSL insights all weekend.