
📊 Inside the Stands: WSL Attendance Trends 2025–26
How Arsenal carried more of the WSL's attendance base than ever, why the league recovered only partly from last season’s dip, and what the full 2025–26 data says about growth, gaps and sustainability

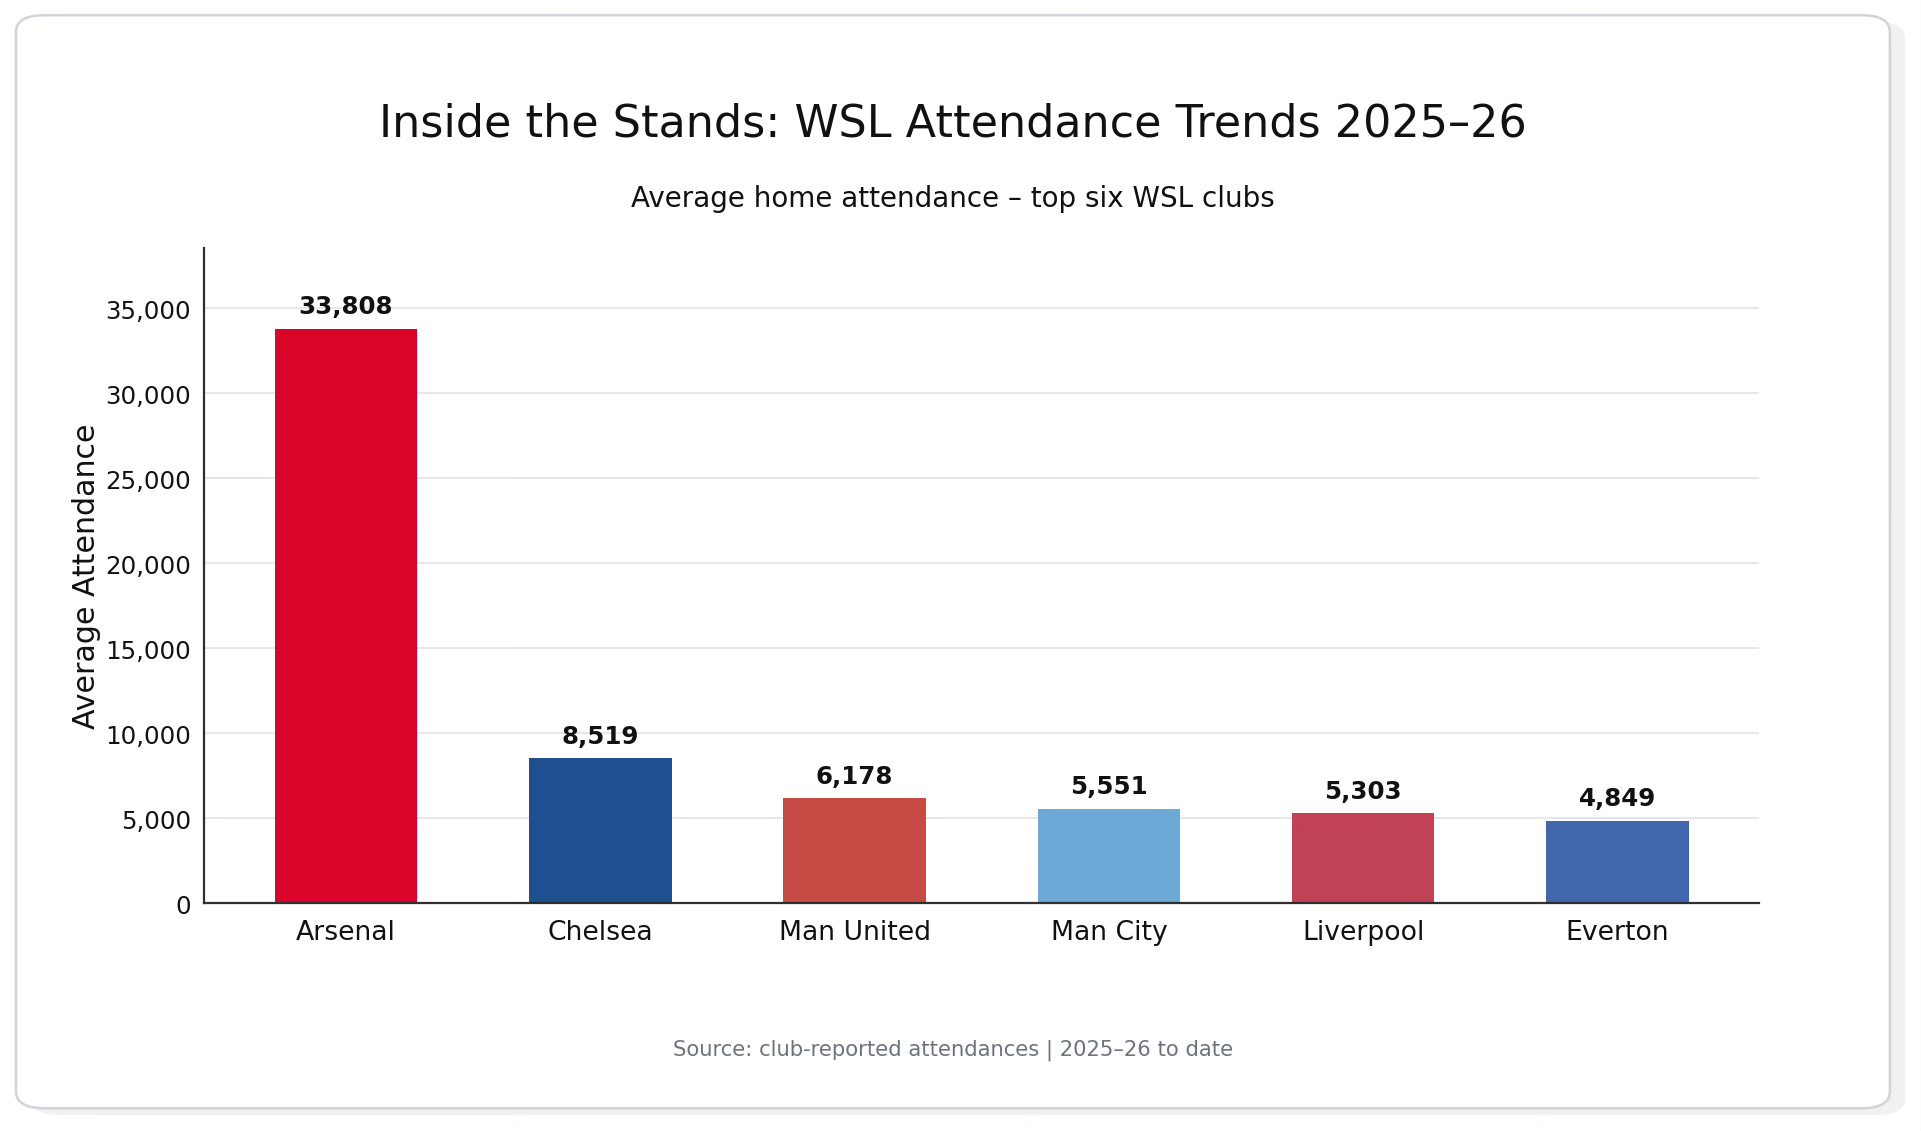
Introduction: a rebound, but not a full recovery
The 2025–26 Barclays Women’s Super League attendance picture tells a story of partial recovery, growing concentration, and a league still trying to turn major-event crowds into a more consistent week-to-week audience.
The headline numbers point upward. The WSL drew 902,981 spectators across 132 matches this season, an average of 6,841 per match. That’s a 2.7% rise on the 2024–25 total of 879,215 – enough, on its own, to call this a recovery season. But it still falls 69,320 short of the 2023–24 peak of 972,301, a 7.1% gap across two seasons that hasn’t closed. In simple terms, the league recovered from last season’s dip – but did not fully return to its recent high point.
Beneath the headline number, the picture gets more complicated. Arsenal aren’t just the league’s attendance leaders; they are the central engine of the WSL's attendance base. Their 371,886 home attendance total accounted for 41.2% of all WSL spectators in 2025–26. Remove Arsenal from the league total, and the rest of the WSL actually fell again, from 562,324 in 2024–25 to 531,095 in 2025–26.
There are still positive signs. Everton made one of the strongest year-on-year jumps, the league recorded no sub-1,000 attendances for the first time across the three seasons, and the median crowd rose from 3,070 to 3,236. But the wider trend remains uneven. Eight of eleven returning clubs saw home attendance decline this season – including five (Tottenham, Liverpool, Manchester United, Brighton and Manchester City) by margins of 10% or more. Around 60% of total attendance still came from matches that drew over 10,000 fans.
So the 2025–26 story is not simply that WSL attendances went up. It is that the league’s ceiling remains high, Arsenal’s dominance is growing, the lower-end floor has improved, but the middle of the attendance market still looks fragile. The next phase of WSL growth will depend not only on selling out the biggest fixtures, but on lifting the regular matchday base across more clubs.
The league-wide trend
Three seasons of WSL data make the shape of this recovery clearer.
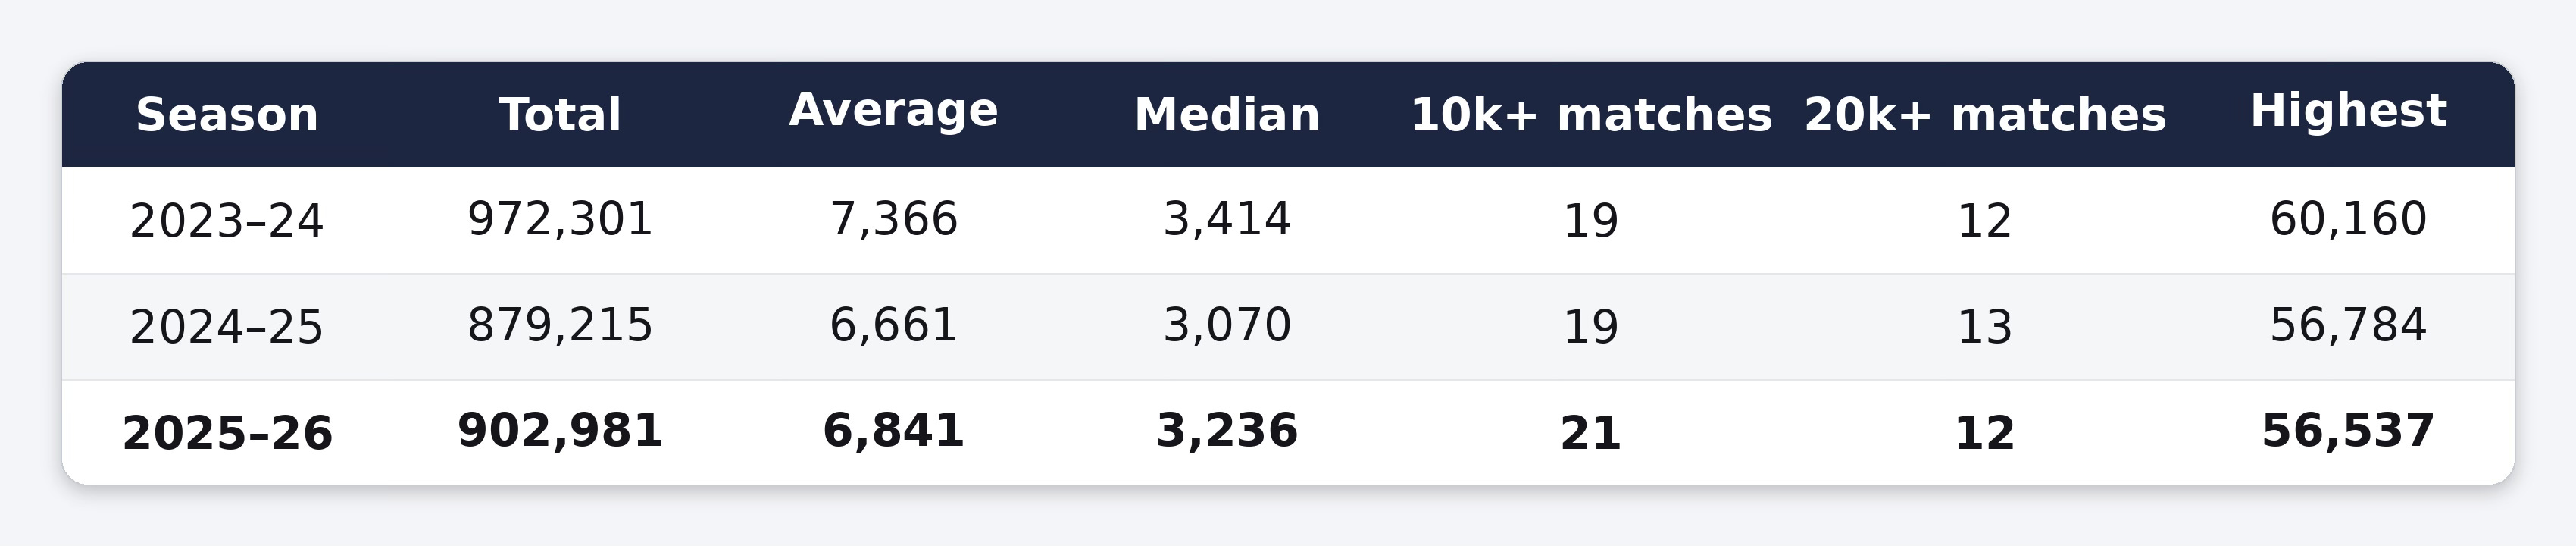
From 2023–24 to 2024–25, total attendance fell by 93,086 – a 9.6% drop. From 2024–25 to 2025–26, it rose by 23,766 – a 2.7% recovery. Encouraging, but still 69,320 below the 2023–24 high.
Record crowds
This season’s biggest single fixture drew 56,537 – the third-highest WSL crowd on record, but a touch below the 56,784 peak of 2024–25 and the all-time record of 60,160 set in 2023–24. The league produced 21 matches at 10,000+ attendance, more than either of the two previous seasons. But only two crossed the 40,000 mark this season, against four in 2024–25 and seven in 2023–24. The very biggest fixtures got rarer, but the broader 10,000+ tier grew.
📈 The Arsenal effect – the WSL central engine
Arsenal didn’t just lead the WSL attendance table in 2025–26. They drew more than four in every ten spectators across the entire league season.
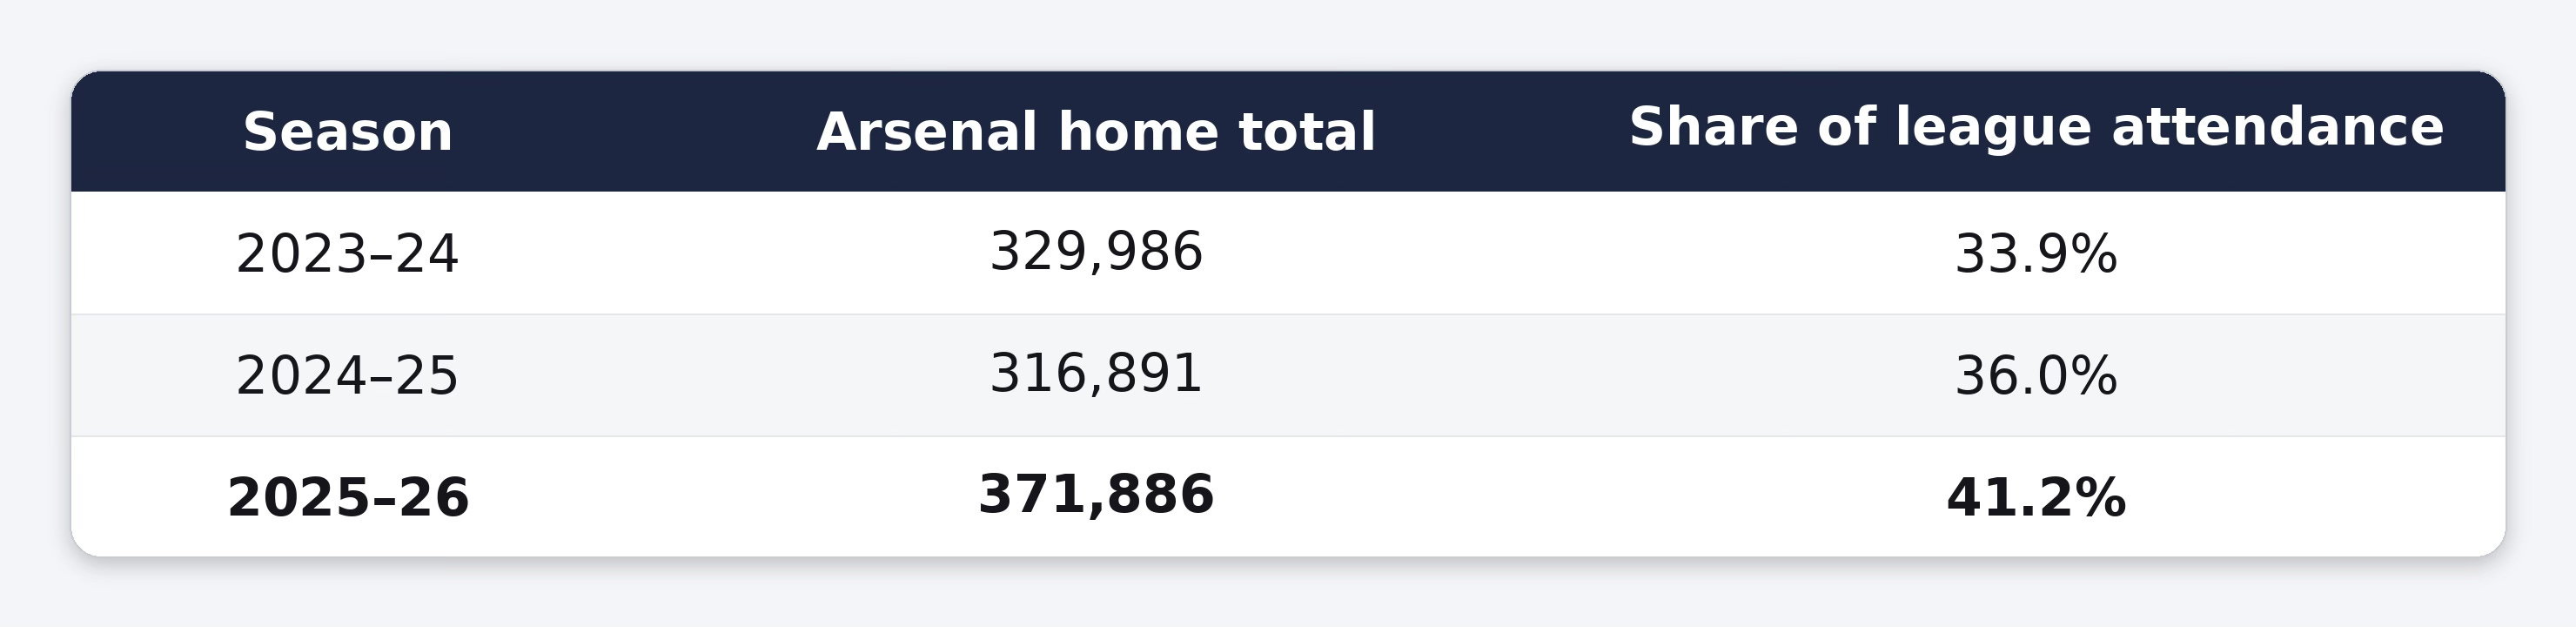
Arsenal’s share has climbed in each of the last three seasons. That hasn’t happened by accident. Arsenal’s move into the Emirates has been a gradual, deliberate scaling rather than an opportunistic one – a handful of showcase fixtures in 2023–24, nine of eleven home matches at the Emirates in 2024–25, and then – for the first time in the club’s history – all eleven WSL home games at the Emirates in 2025–26.
It was a sensible way to scale up: give the matchday operation a year to bed in at nine fixtures, then take the final step in year two. And it’s now a permanent commitment – Arsenal have already confirmed that all 13 of their 2026–27 WSL home fixtures, in an expanded 14-team league, will again be played at the Emirates.
The hidden trend: without Arsenal, the league is still falling
Probably the most important number in this season’s data isn’t 902,981. It’s what’s left when you take Arsenal away.
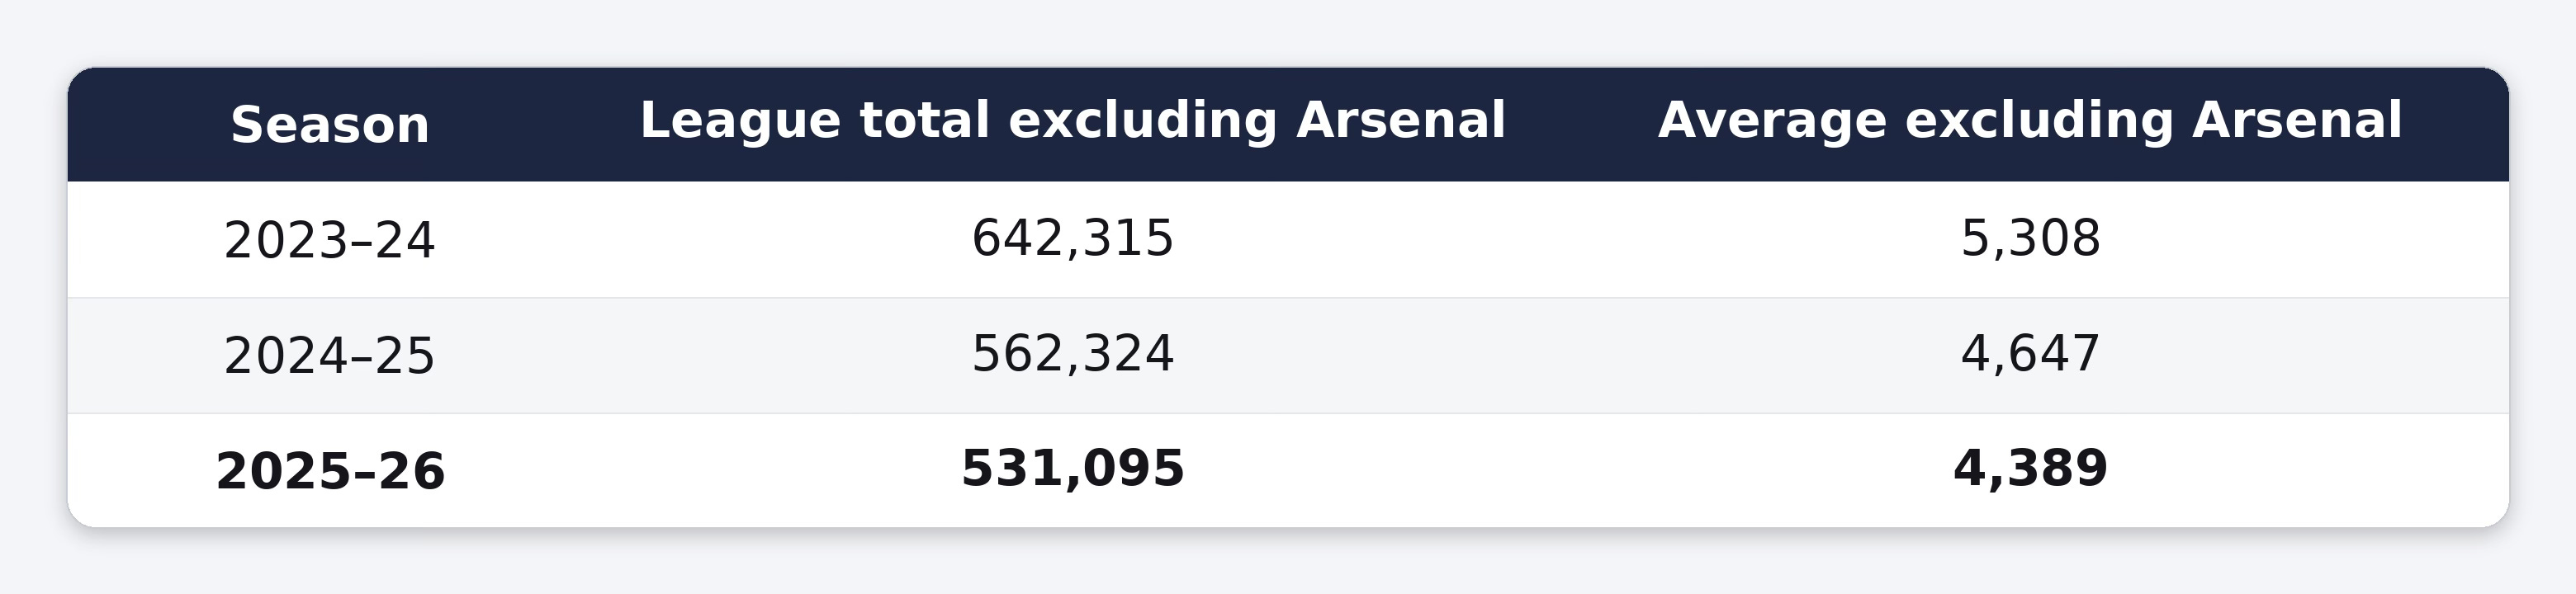
The headline number says the WSL recovered in 2025–26. But remove Arsenal, and the rest of the league actually fell again – continuing a two-season decline that began in 2023–24. That’s the tension at the heart of this year’s data: a league that looks healthier in aggregate, but whose growth is being carried by a single club.
Club-by-club: the full picture
Among clubs present in both seasons, here is the full year-on-year change:
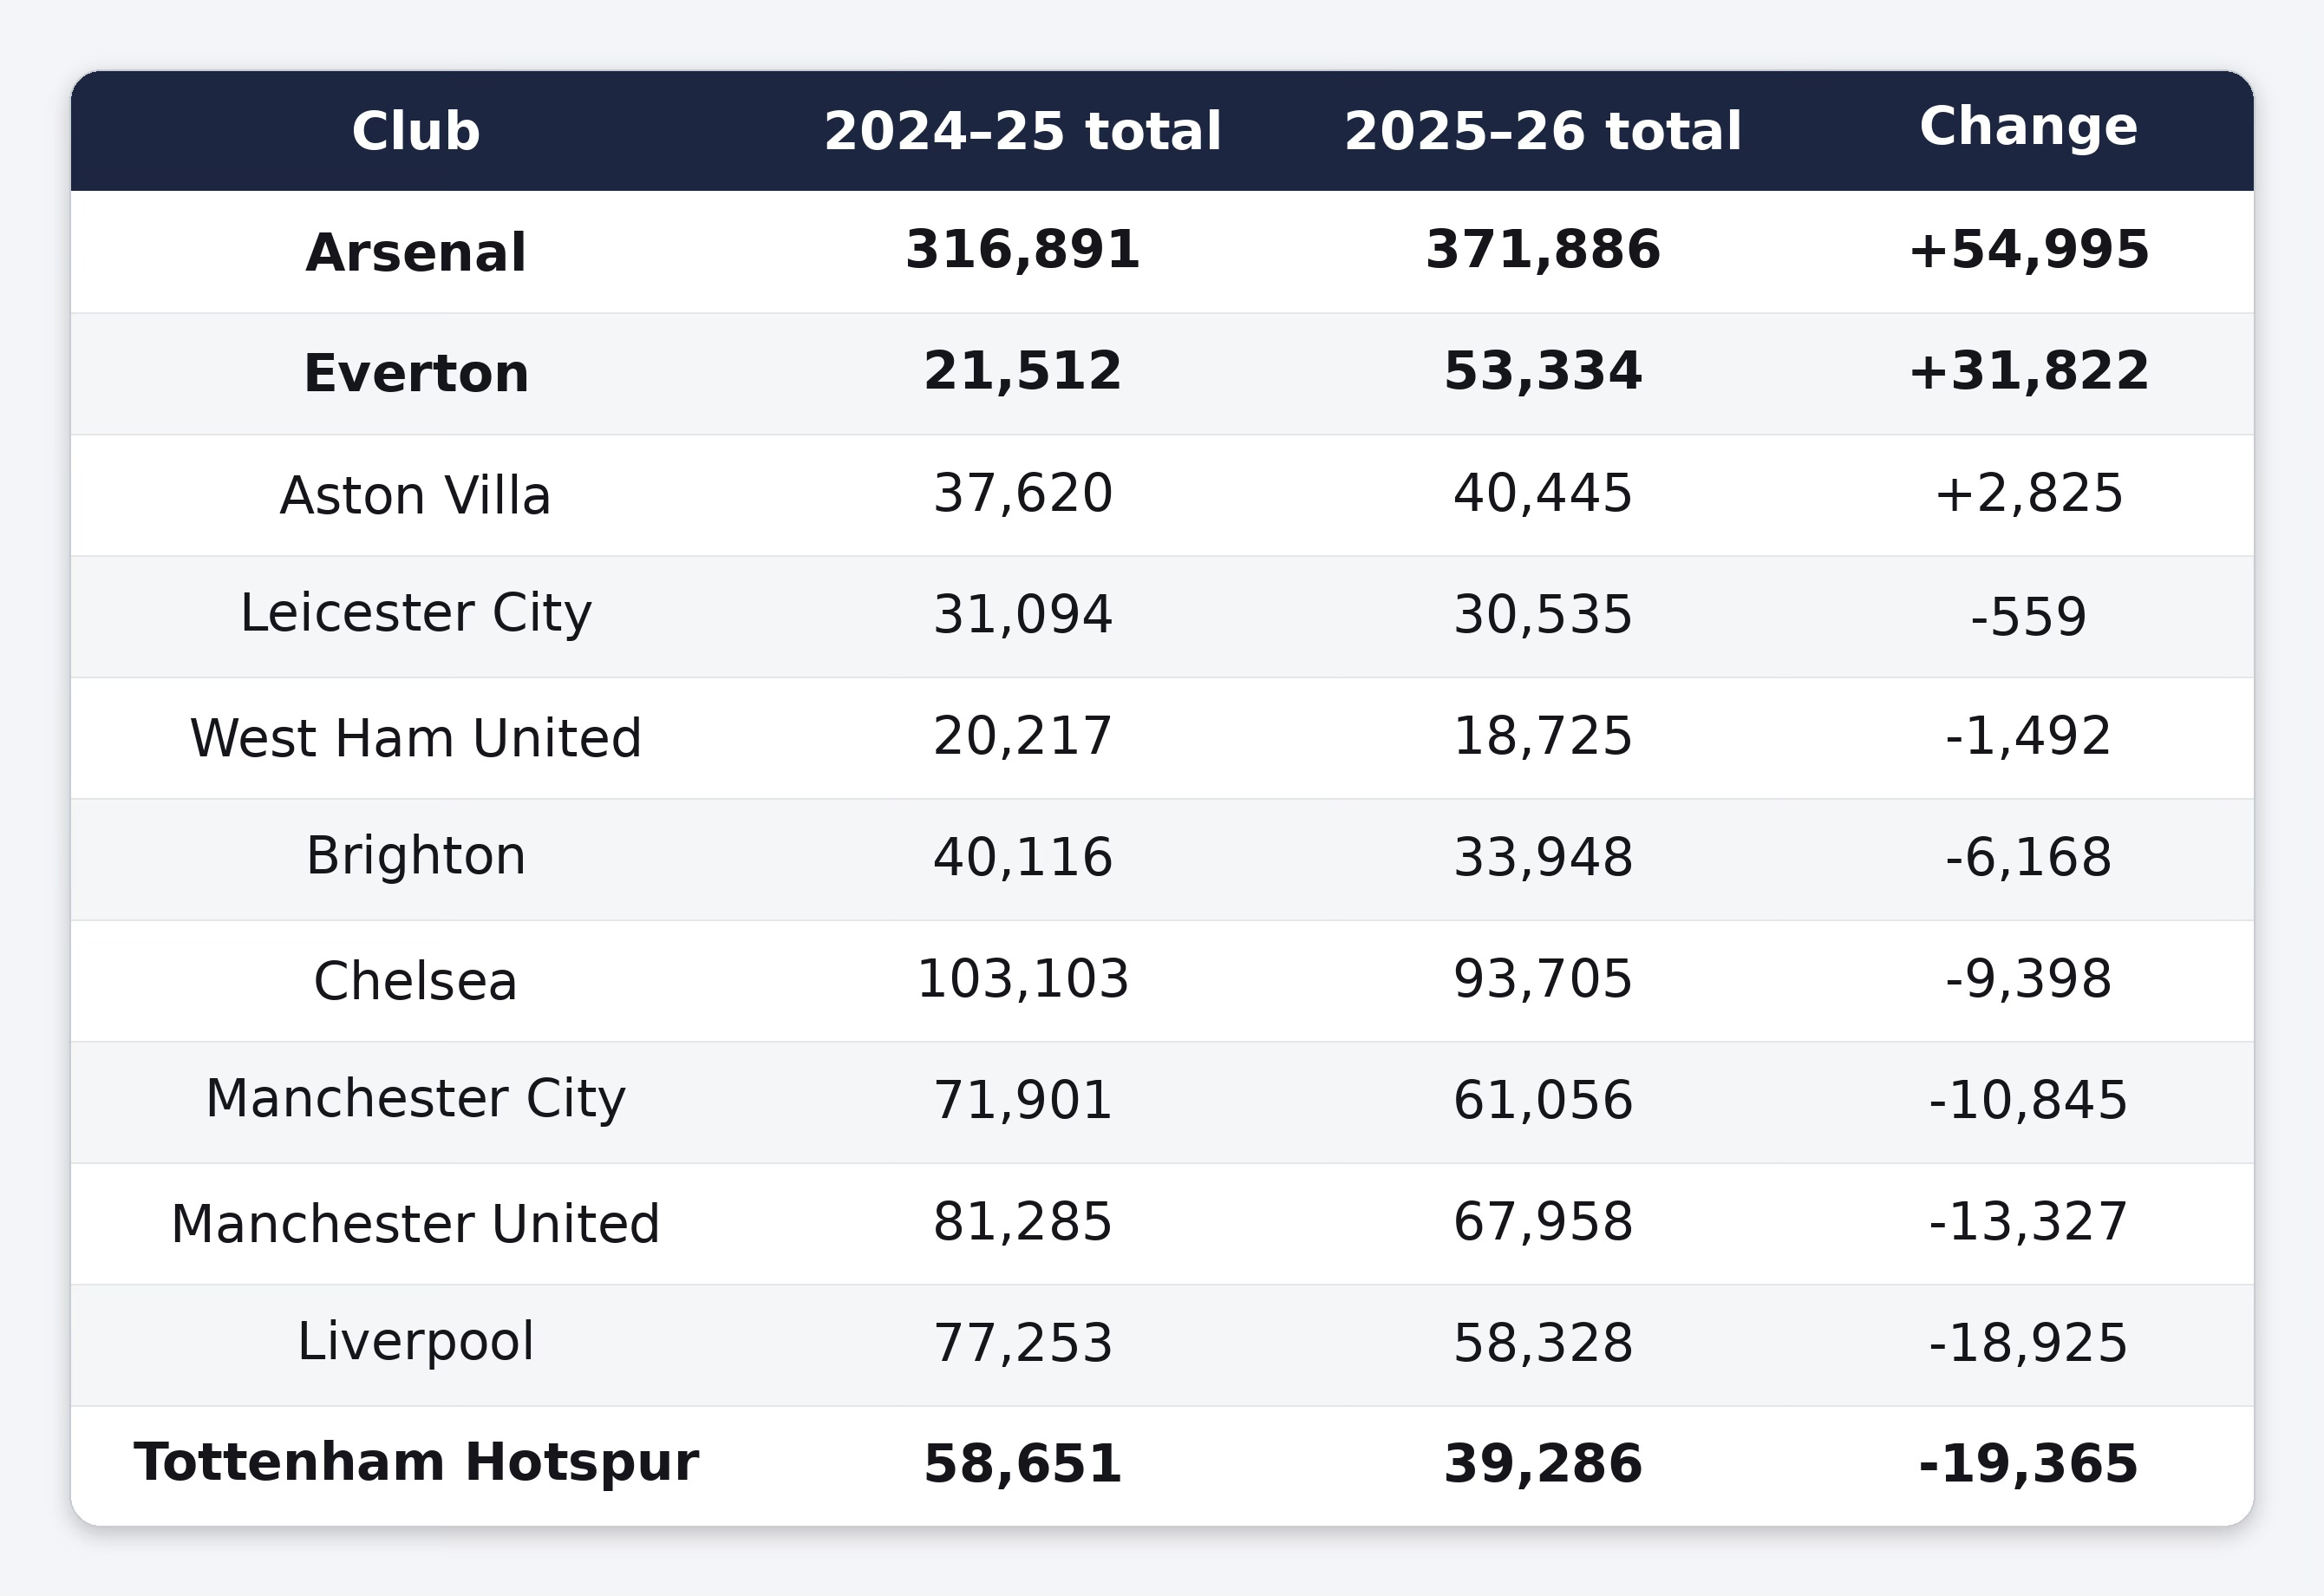
The recovery in 2025–26 is, in net terms, an Arsenal-and-Everton story. Together those two clubs added 86,817 to the league total. Across the other nine clubs that played in both seasons, the net change was -77,254 – with eight of those nine clubs declining year-on-year, and only Aston Villa adding meaningfully on the upside.
Chelsea, United and City – still powerful, but softer
Chelsea, Manchester United and Manchester City still sit in the league’s upper attendance tier. But all three declined year-on-year, and the gap between their biggest showcase fixtures and their regular home gates remains the defining feature of their season.
🔵 Chelsea
Chelsea’s home total fell from 103,103 to 93,705 – a drop of 9,398 – and they lost their place in the 100k club. The intuitive reading is that they hosted fewer Stamford Bridge occasions; the data says the opposite. They actually played one more fixture at the Bridge this season (four to three), and the Kingsmeadow baseline barely moved (average 3,497 to 3,357). The shortfall sits entirely at the Bridge end of the schedule, where the average gate dropped 30% year-on-year, from 25,043 to 17,552. Every like-for-like big fixture fell – Arsenal held up best at -11% (34,302 to 30,545), Manchester City took the heaviest hit at -27% (19,499 to 14,182). The single biggest swing came from scheduling: Liverpool was a 21,327 Bridge fixture last May; this season it was held at Kingsmeadow and drew 3,973.
Chelsea have now announced a full thirteen-game Bridge slate for 2026-27, which should be a structural tailwind – but the contraction in average Bridge gates raises a question: without deliberate marketing effort and narrative-building around these occasions, moving from four Bridge fixtures to thirteen risks diluting the “event” status of each one. The venue change alone won’t move the needle unless Chelsea commit to advertising, publicity, and creating genuine scarcity around these fixtures.
🔴 Manchester United
United’s home total slipped from 81,285 to 67,958 – down 13,327 – but the deeper trajectory is sharper than the year-on-year comparison suggests. Two seasons ago they pulled 120,526 finishing second in the league for total attendance. They’ve now dropped to third in each of the last two seasons, down roughly 44% from their 2023-24 peak.
The mechanism this year is structural: one fewer Old Trafford fixture. They hosted two Old Trafford games in 2023-24 (72,352 combined) and two again in 2024-25 (40,226), but only one this season – the Manchester derby. A second Old Trafford fixture against Aston Villa was originally scheduled before being moved to Leigh, which alone costs the season total a chunk.
The harder story sits inside the derby itself: at Old Trafford, the Manchester derby has now declined three years running – 43,615 → 31,465 → 24,983 – losing roughly 19,000 from its peak at the same venue. That’s a demand problem at their marquee fixtures, not a scheduling one.
The Arsenal fixture at Leigh is the standout: 8,312 → 8,348 → 8,665, three consecutive club-record gates all bumping against the ground’s ceiling. That’s demand constrained by capacity rather than interest – it could go significantly bigger if relocated to Old Trafford. The derby has lost 19,000 in two years at the biggest ground; Arsenal keeps hitting the roof at the smallest one. The Old Trafford strategy clearly needs to be sharper.
🔵 Manchester City
City delivered a very strong on-pitch performance this season, winning their first WSL title in ten years. But that success did not translate into a bigger home crowd. Their total home attendance fell from 71,901 to 61,056 – down 10,845 – and the decline appears to be driven mainly by venue mix, with one important fixture-level exception.
The biggest structural change was the reduction in Etihad fixtures. City moved from three Etihad matches last season to two this season. The Tottenham fixture, which drew 10,319 at the Etihad last season, was played at the Joie Stadium this year and drew 4,575. That single venue switch explains a large part of the overall fall.
The two remaining Etihad fixtures averaged slightly higher than last season – 15,374 vs 14,706 – so the showcase venue itself does not appear to be losing broad demand. There were simply fewer Etihad fixtures on the calendar.
At the Joie Stadium, the everyday baseline barely moved. City averaged 3,473 there last season and 3,368 this season. Individual Joie fixtures ranged from 2,267 against West Ham to 4,869 against Liverpool, but the distribution was broadly similar year-on-year.
The key exception is the Manchester derby. City’s Etihad derby attendance fell from 22,497 to 17,520 – down roughly 5,000 for the same fixture at the same venue. That mirrors the softening seen in United’s derby at Old Trafford and suggests the City–United matchup cooled at both ends, rather than this being only a City-specific issue.
The bigger question now is whether City’s title-winning campaign produces an attendance bump next season – especially if the club keeps a stronger Etihad presence in the fixture calendar.
⚖️ The middle is shifting – Everton up, Liverpool and Spurs down
This is where the 2025–26 story gets genuinely fresh.
🔵 Everton – the standout riser
Everton more than doubled their home total this season, from 21,512 to 53,334 – a 147.9% increase and the second-largest absolute gain among established clubs, behind Arsenal. They ranked 10th of 12 by home total last season; they now sit 6th.
The mechanism is structural rather than organic. Everton effectively retired Walton Hall Park as a default venue: last season they played nine of eleven fixtures there, this season none. Goodison Park became the regular home (ten fixtures, up from two), and a single showcase fixture against Manchester United at Hill Dickinson Stadium drew 18,154 – that one game alone drew over 80% of Everton’s entire home total in either of the previous two seasons.
Alongside Arsenal, Everton is one of only two established clubs driving the league’s headline rebound – without these two, the rest of the league’s attendance fell 11.7%.
🔴 Liverpool – a sharp pullback
Liverpool’s home total fell from 77,253 to 58,328 – down 18,925, the second-biggest fall in the league. The mechanism here isn’t venue access: Liverpool played the same three Anfield fixtures in both seasons. What changed is how many people turned up.
Anfield average attendance dropped 25% (16,152 → 12,113), and the smaller-venue average dropped 24% (3,600 → 2,755). The decline runs cleanly across both venue tiers in roughly equal proportion – broad demand pullback rather than a structural shift.
⚪ Tottenham – the biggest absolute fall
Tottenham’s home total fell from 58,651 to 39,286 – down 19,365, the largest absolute decline of any club. But the fall is almost entirely one fixture: the Arsenal derby moving venue.
In 2024-25, Spurs hosted Arsenal at Tottenham Hotspur Stadium and drew 28,852 – 49% of their entire home total for the season. In 2025-26, the Arsenal home fixture moved to BetWright Stadium and drew 6,788. That single swing is -22,064, which exceeds Spurs’ entire annual decline. Strip it out and the rest of the schedule nets slightly positive – their smaller-venue matches collectively rose from 12,998 to 17,804.
So while Liverpool and Spurs both posted big falls, the mechanisms differ. Liverpool is broad demand softening; Spurs is one missing showcase fixture.
The middle of the table didn’t move together – it mostly fell. Eight of eleven returning clubs declined; only Arsenal, Everton and Aston Villa rose. Spurs and Liverpool were the sharpest, but the pattern was broad.
⚠️ The lower and lower-middle tier – the floor lifted, but gaps remain
At the lower end, the picture is more mixed than headline averages suggest.
Aston Villa edged up from 37,620 to 40,445 – the only established mid-tier club to grow this season. Brighton drew 33,948, down from 40,116 (-6,168), dropping from 7th to 9th in the league. London City Lionesses arrived in the WSL and settled at 33,775 – 10th of 12 by home total, averaging 3,070 across the season. Leicester City were almost unchanged at 30,535 against 31,094. West Ham remained the clear outlier at the bottom with 18,725, down from 20,217 – and still account for 8 of the 22 remaining sub-2,000 matches.
The encouraging counterpoint sits in the distribution rather than any individual club:
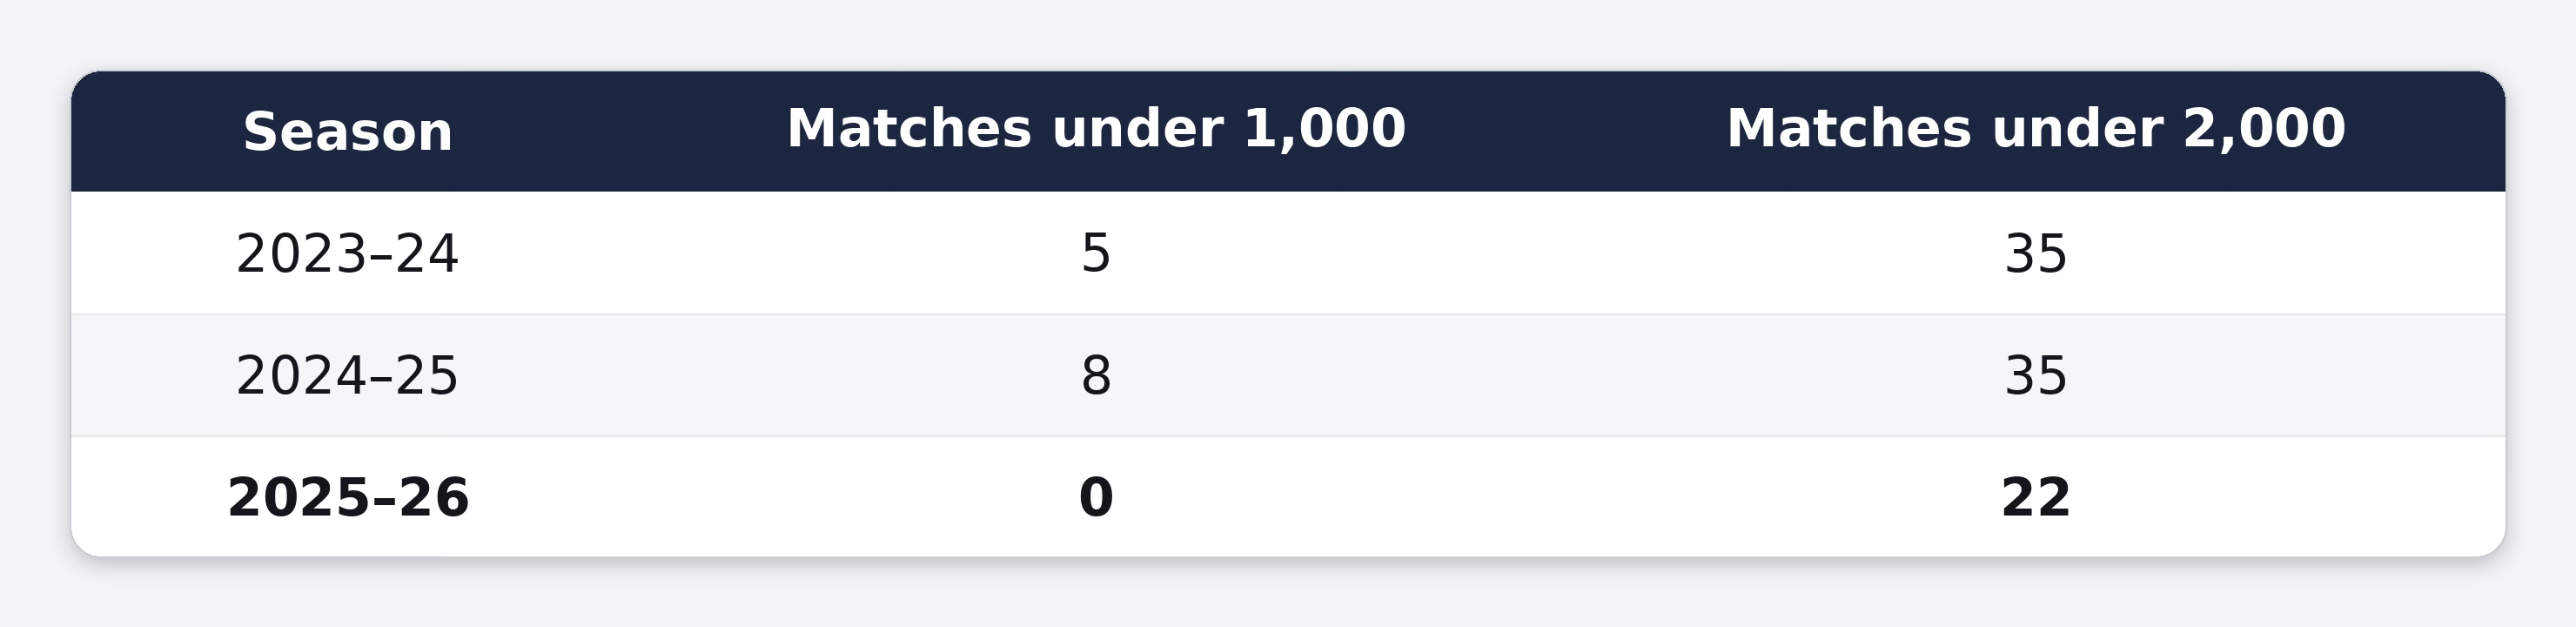
For the first time across these three seasons, no WSL match drew fewer than 1,000 fans, and the number of matches under 2,000 fell from 35 to 22. But the mechanism isn’t organic growth at the bottom – it’s structural. The two venues responsible for most of last season’s sub-1,000 matches are gone from the schedule: Walton Hall Park left with Everton’s move to Goodison; VBS Community Stadium left with Crystal Palace’s relegation. The floor lifted because the two venues defining it were removed – the same mechanism driving Everton’s rise.
The bottom of the league looked healthier than it has in years – even as Arsenal pulled further away at the very top.
🔄 The promoted-club effect: London City Lionesses
The newcomer slot has shifted league attendance differently in each of the last three seasons:
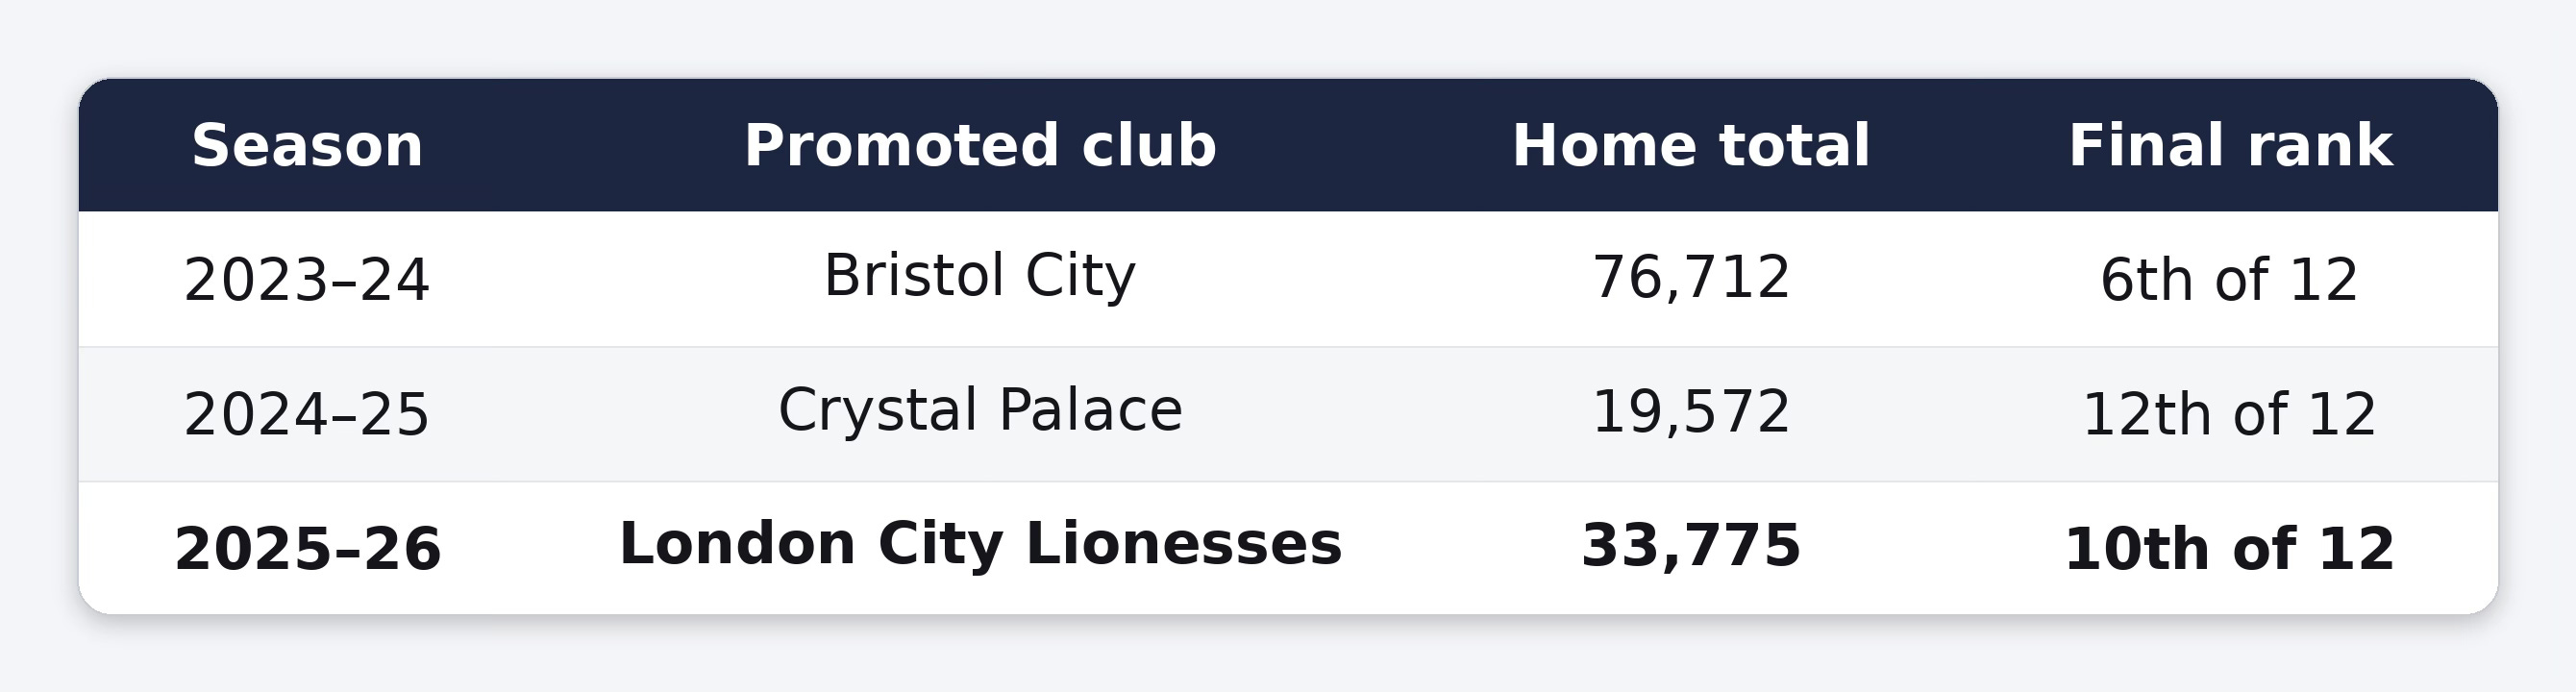
The variation isn’t about drawing power – it’s about venue access. Bristol City played all 11 fixtures at Ashton Gate Stadium, their men’s team’s ground (capacity ~27,000). Crystal Palace split between Selhurst Park (3 fixtures) and the smaller VBS Community Stadium (8). LCL play 10 of 11 at Copperjax Community Stadium, with one at The Den. Big-venue access shapes the newcomer total each year more than anything else.
Head-to-head against the same opponents makes the point concrete:
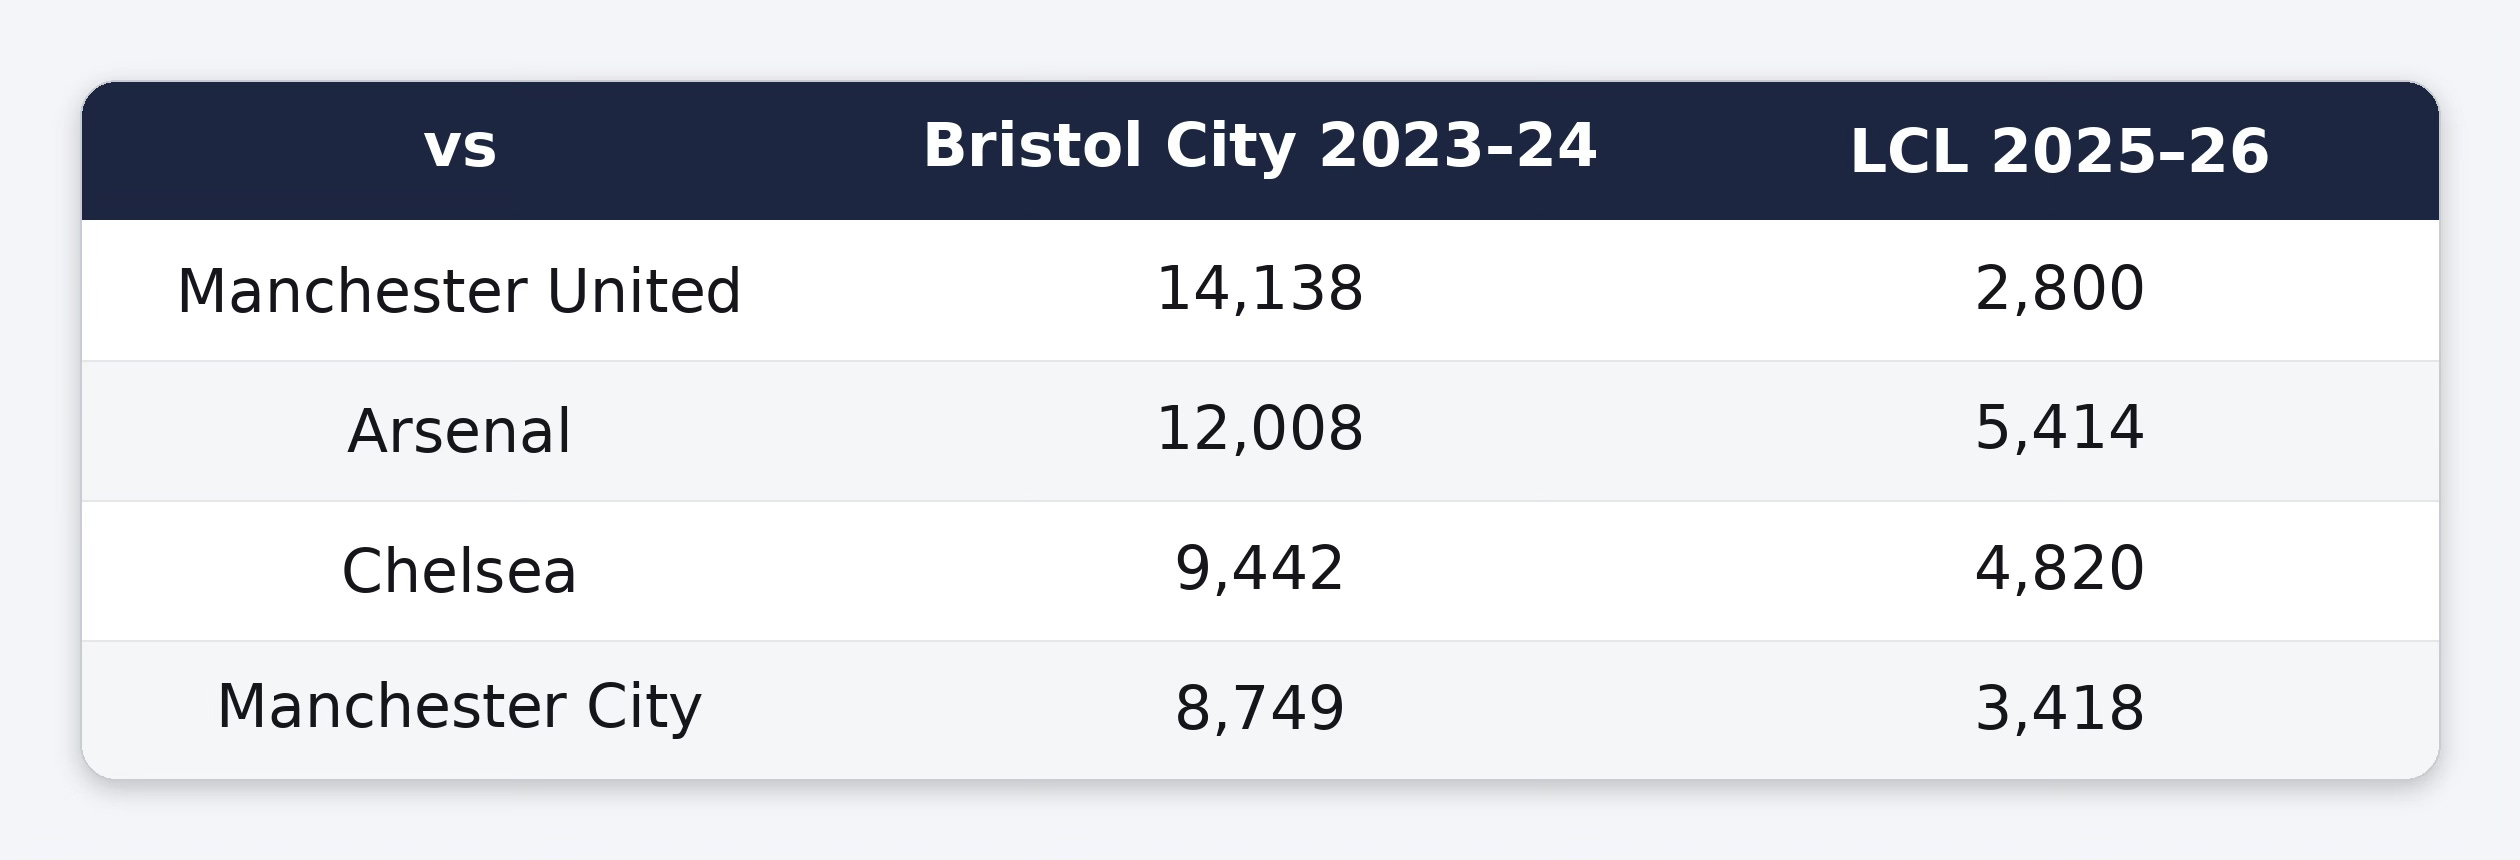
Same fixtures, different venues, different attendance.
LCL improved on Crystal Palace’s 2024-25 total by 14,203 – they’ve slotted into lower-middle rather than at the bottom. But they drew 42,937 fewer than Bristol City did two seasons ago, and that single gap accounts for 62% of the 69,320-fan shortfall between the 2025-26 and 2023-24 league totals. The other 38% sits with established clubs collectively drawing less than they did two seasons back.
The same structural mechanism running through the rest of this piece: venue moves, relegations, and which tier the newcomer plays in are doing more of the work than organic demand change.
The big-stadium dependency hasn’t gone away
Across the last three seasons, roughly 60% of WSL attendance has come from a small group of 10,000+ matches:
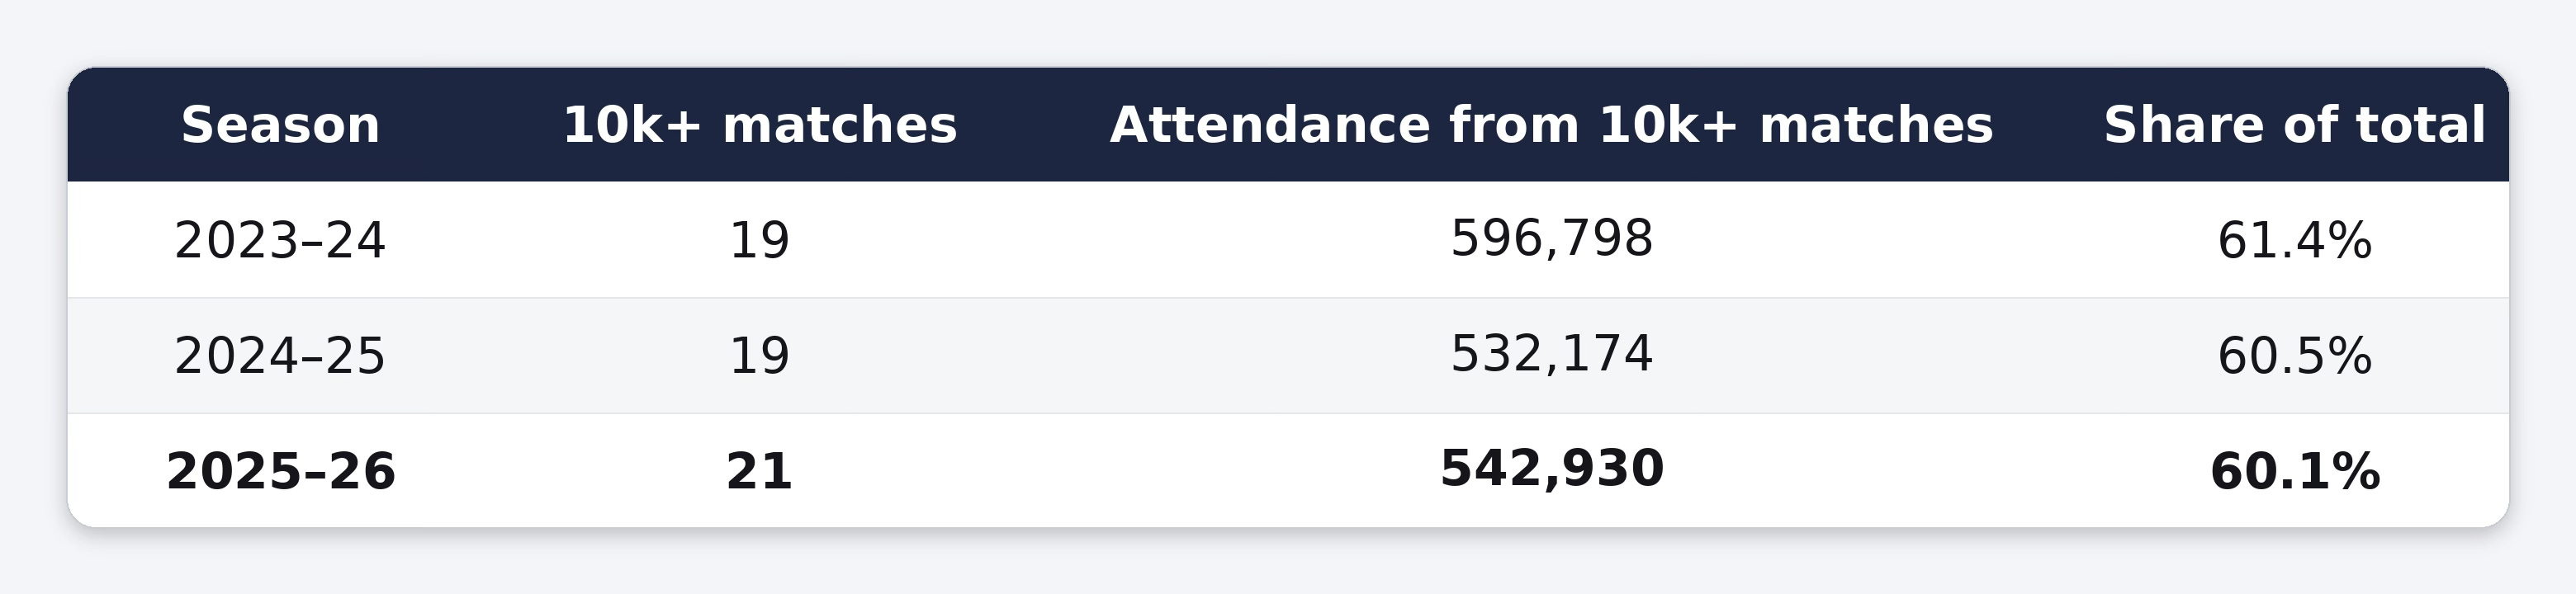
The count grew slightly this season, but average attendance within the 10k+ group fell from 31,410 (2023-24) to 25,854 (2025-26). More big-venue matches, each drawing fewer people on average – the tier is broadening at the base while compressing at the peak.
That peak compression is concentrated in one finding: the 40k+ tier has become an Arsenal-only category.
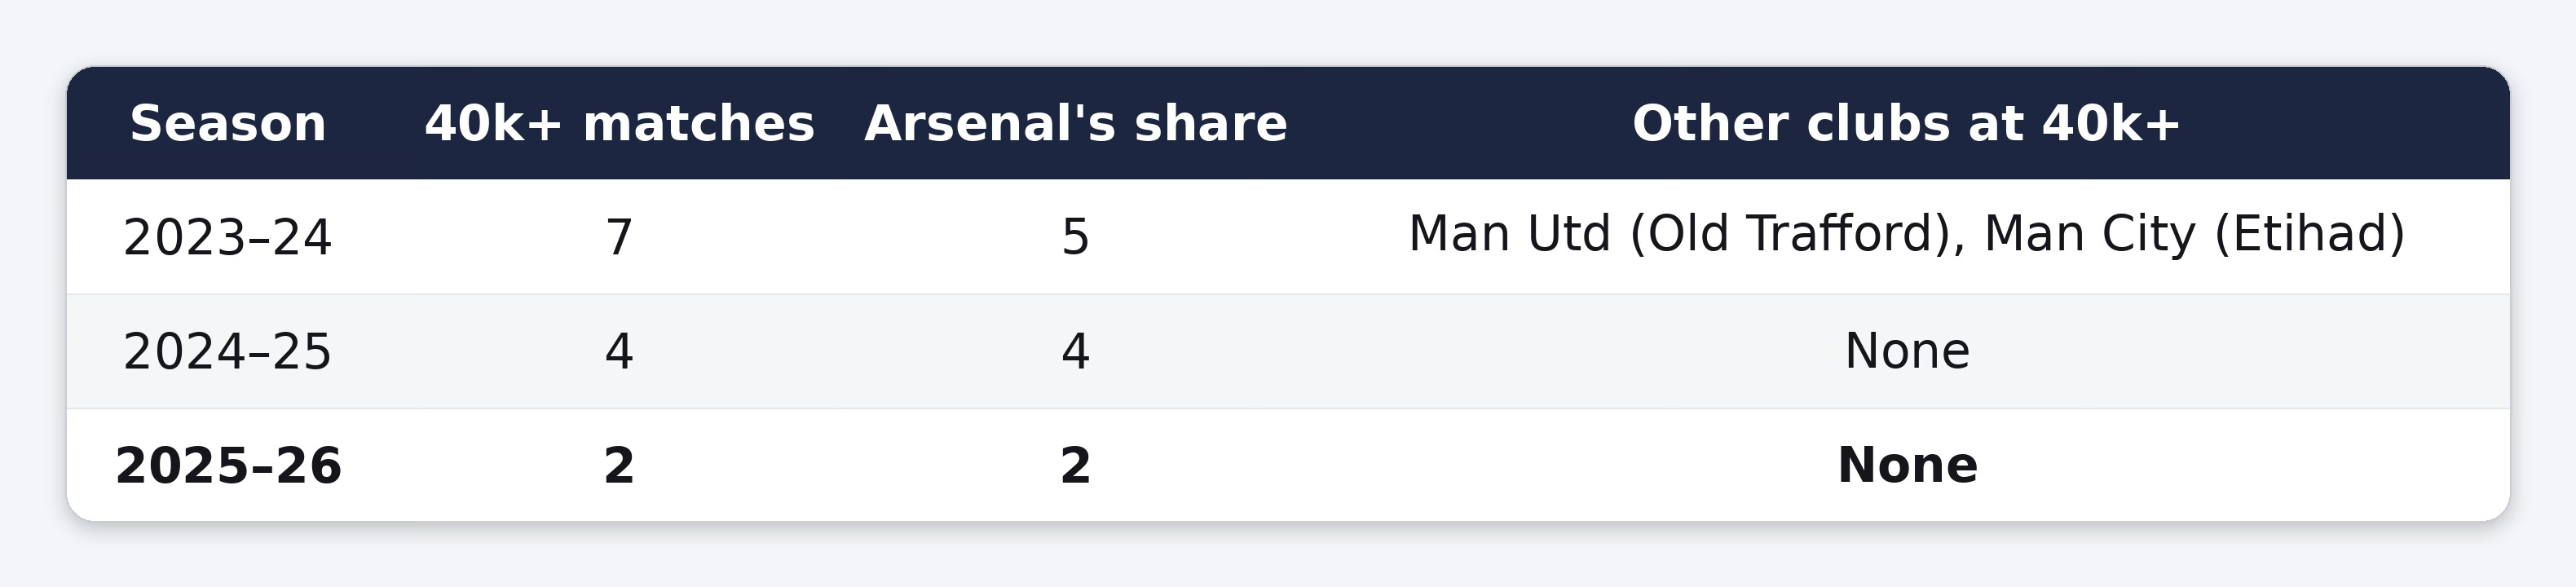
Every 50k+ match across all three seasons has been Arsenal at the Emirates. The “mega-event peaks” weren’t a league-wide phenomenon that thinned out – they were always concentrated at Arsenal, and the tier is now exclusively Arsenal’s.
What grew in its place is the 20-40k mid-tier. Across the three seasons, that band went from 5 matches (14.5% of attendance) to 9 (28.6%) to 10 (33.9%). So while the 40k+ tier contracted, the 20-40k showcase band roughly doubled in share. Clubs are still unlocking bigger venues for marquee fixtures – they’re just not filling 40k+ stadiums.
The question for 2026-27 isn’t whether the league can rebuild the 40k+ layer – Arsenal already operates there, and is growing within it. The question is whether non-Arsenal clubs return to it. Chelsea, Man Utd, Man City and Liverpool all have the venue capacity; none has cracked 40k since 2023-24.
📌 Closing thoughts – raise the floor, not just the ceiling
Last season’s piece closed with a line about the WSL’s next step being to raise the floor, not just the ceiling. A year on, that argument has only sharpened.
Arsenal’s ceiling is doing fine. They continue to set a new bar for what a women’s football matchday can look like in England, and the league as a whole still produced 21 fixtures at 10,000+ this season. There were no sub-1,000 attendances anywhere for the first time – which says something genuinely positive about the floor too.
But the ceiling-as-a-tier has narrowed and the middle is fragile. The 40k+ category is now an Arsenal monopoly: Manchester United and Manchester City both cracked it in 2023-24, neither has since. Five established clubs declined by significant margins (10%+ year-on-year): Tottenham, Liverpool, Manchester United, Brighton and Manchester City. Non-Arsenal attendance has fallen in each of the last two seasons – from 642,315 in 2023-24 to 531,095 this season, a 17% drop while Arsenal grew. The league’s reliance on a small number of big-stadium fixtures – still around 60% of total attendance – hasn’t budged.
The 2025-26 numbers don’t show a league running out of momentum. They show a league whose growth has become unevenly distributed – with Arsenal now accounting for 41% of all WSL attendance, up from 34% two seasons ago.
The next step is the same as last year’s, only more urgent: build out the regular matchday base across more clubs, so that recovery in the headline total reflects a recovery across the whole league – not just at the Emirates.
💬 What do you think?
Which club’s attendance story stood out most this season – and where does the WSL need to go next to turn marquee crowds into a more consistent week-to-week audience?
👋 Stay connected
If you want weekly WSL insights, stat deep dives and match previews, subscribe and share. We’d also love to hear your thoughts – reply or comment below 💬
Follow @WSLAnalytics on X for bite-sized stats and updates.