
Inside the Stands 2.0 – How fixture, venue and kick-off time shape WSL crowds in 2025–26
Big-stadium showcase fixtures drive huge crowds while core grounds lag – London, Merseyside and Manchester dominate as early-season data reveal where and when WSL fans turn up.

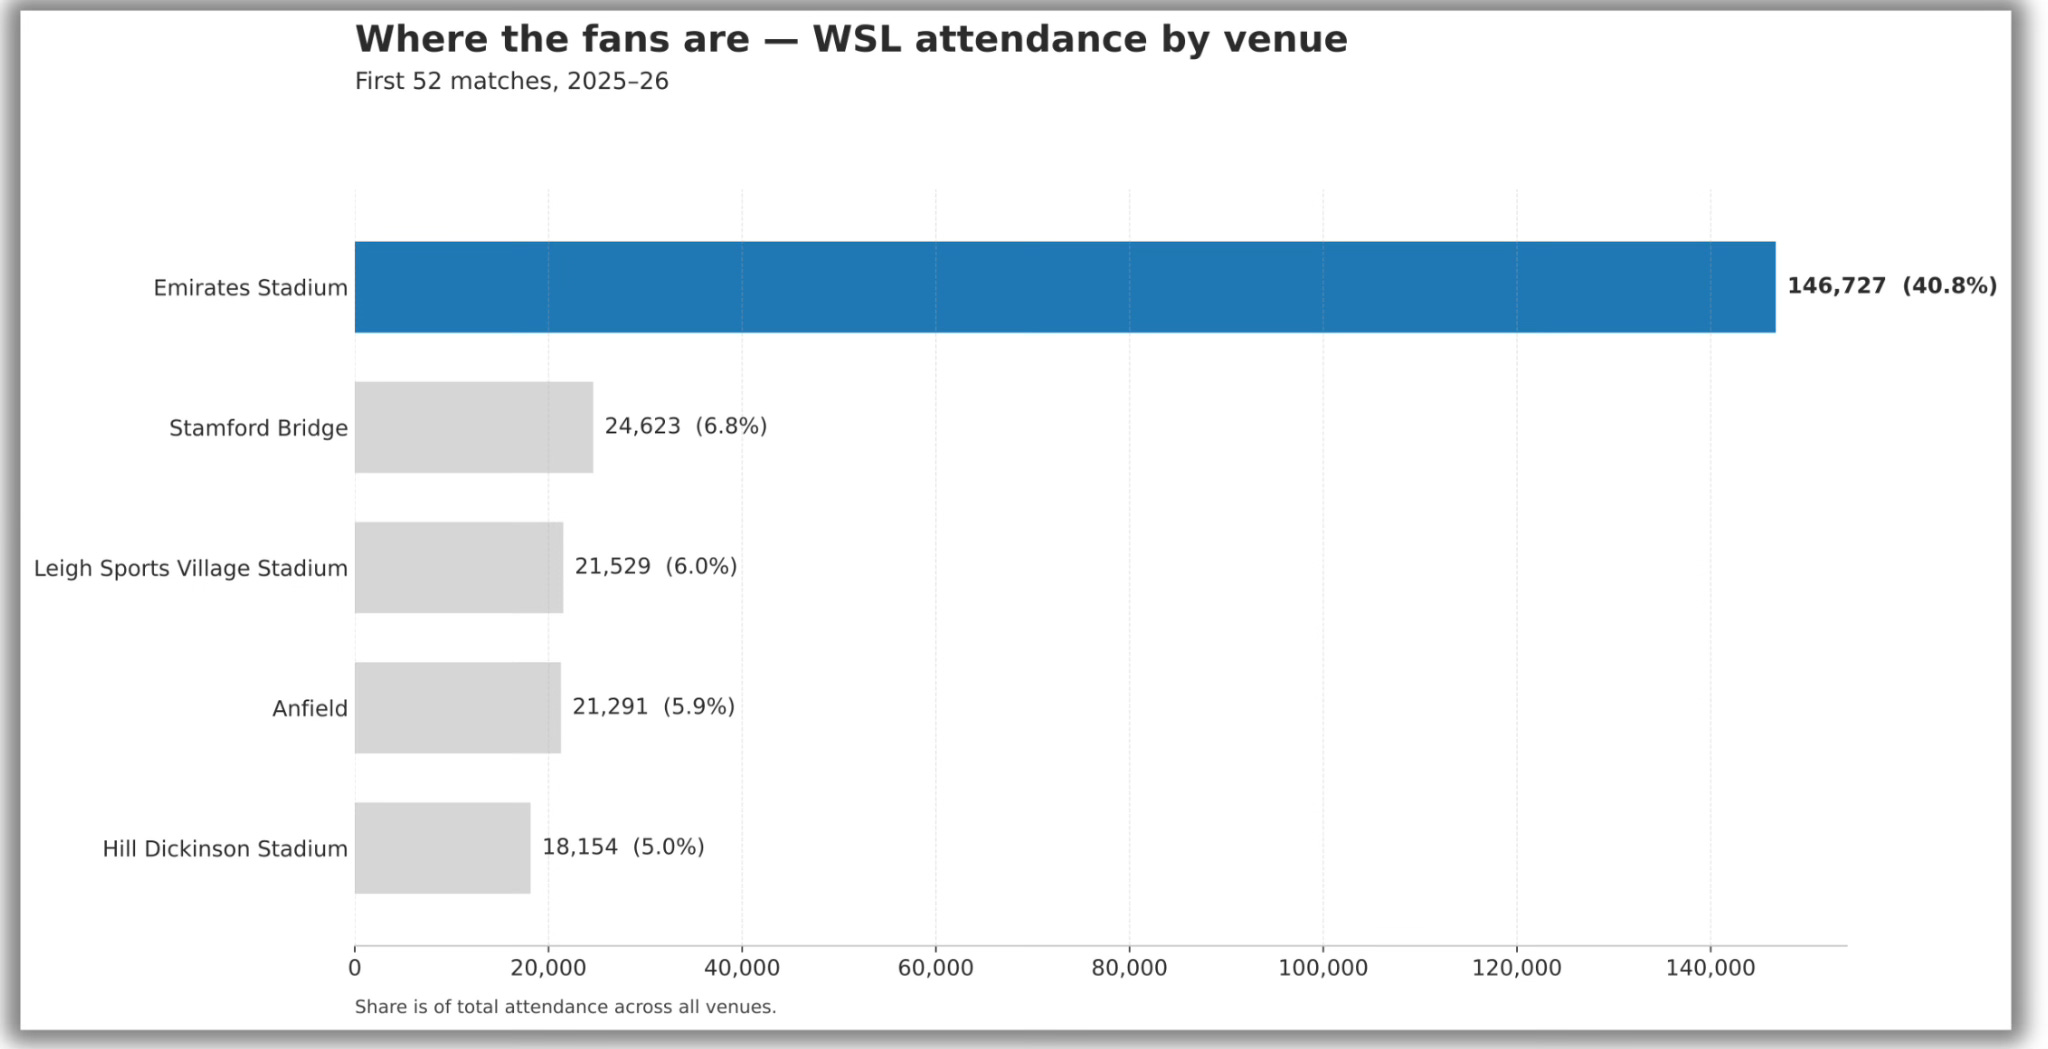
Figure 1 – Where the fans are. Emirates Stadium alone accounts for 40.8% of all attendance across the first 52 matches, with Stamford Bridge, Leigh Sports Village, Anfield and Hill Dickinson forming the next tier.
The first Inside the Stands piece, at the end of 2024–25, looked at league-wide trends – who was filling grounds, how the average moved, and what that meant for growth.
At the start of this season, the Round 1 attendance report showed a strong rebound – bigger venues, smarter scheduling, and a clear sense that the league’s appeal had snapped back.
This follow-up goes a level deeper again.
Using attendance data for 52 WSL fixtures from the 2025–26 campaign so far – including fixture, venue, city and kick-off time – it asks a more detailed question:
When do WSL fans actually turn up – and where?
1. Big picture – what this dataset shows
Across the first 52 matches of the 2025–26 WSL season, the data shows:
Total attendance: 359,829
Average crowd: ≈ 6,920 per game
Median crowd: 3,238 (so the “typical” game is much smaller than the average)
Venues: 17 different grounds
Cities: 12 city locations
That gap between the mean (≈ 6.9k) and median (3.2k) already tells an interesting story:
A relatively small number of very big crowds are pulling the averages up for everyone else.
2. Venue story – Emirates as the WSL’s attendance engine
2.1 Top venues by total attendance
By total spectators through the turnstiles, five venues dominate:
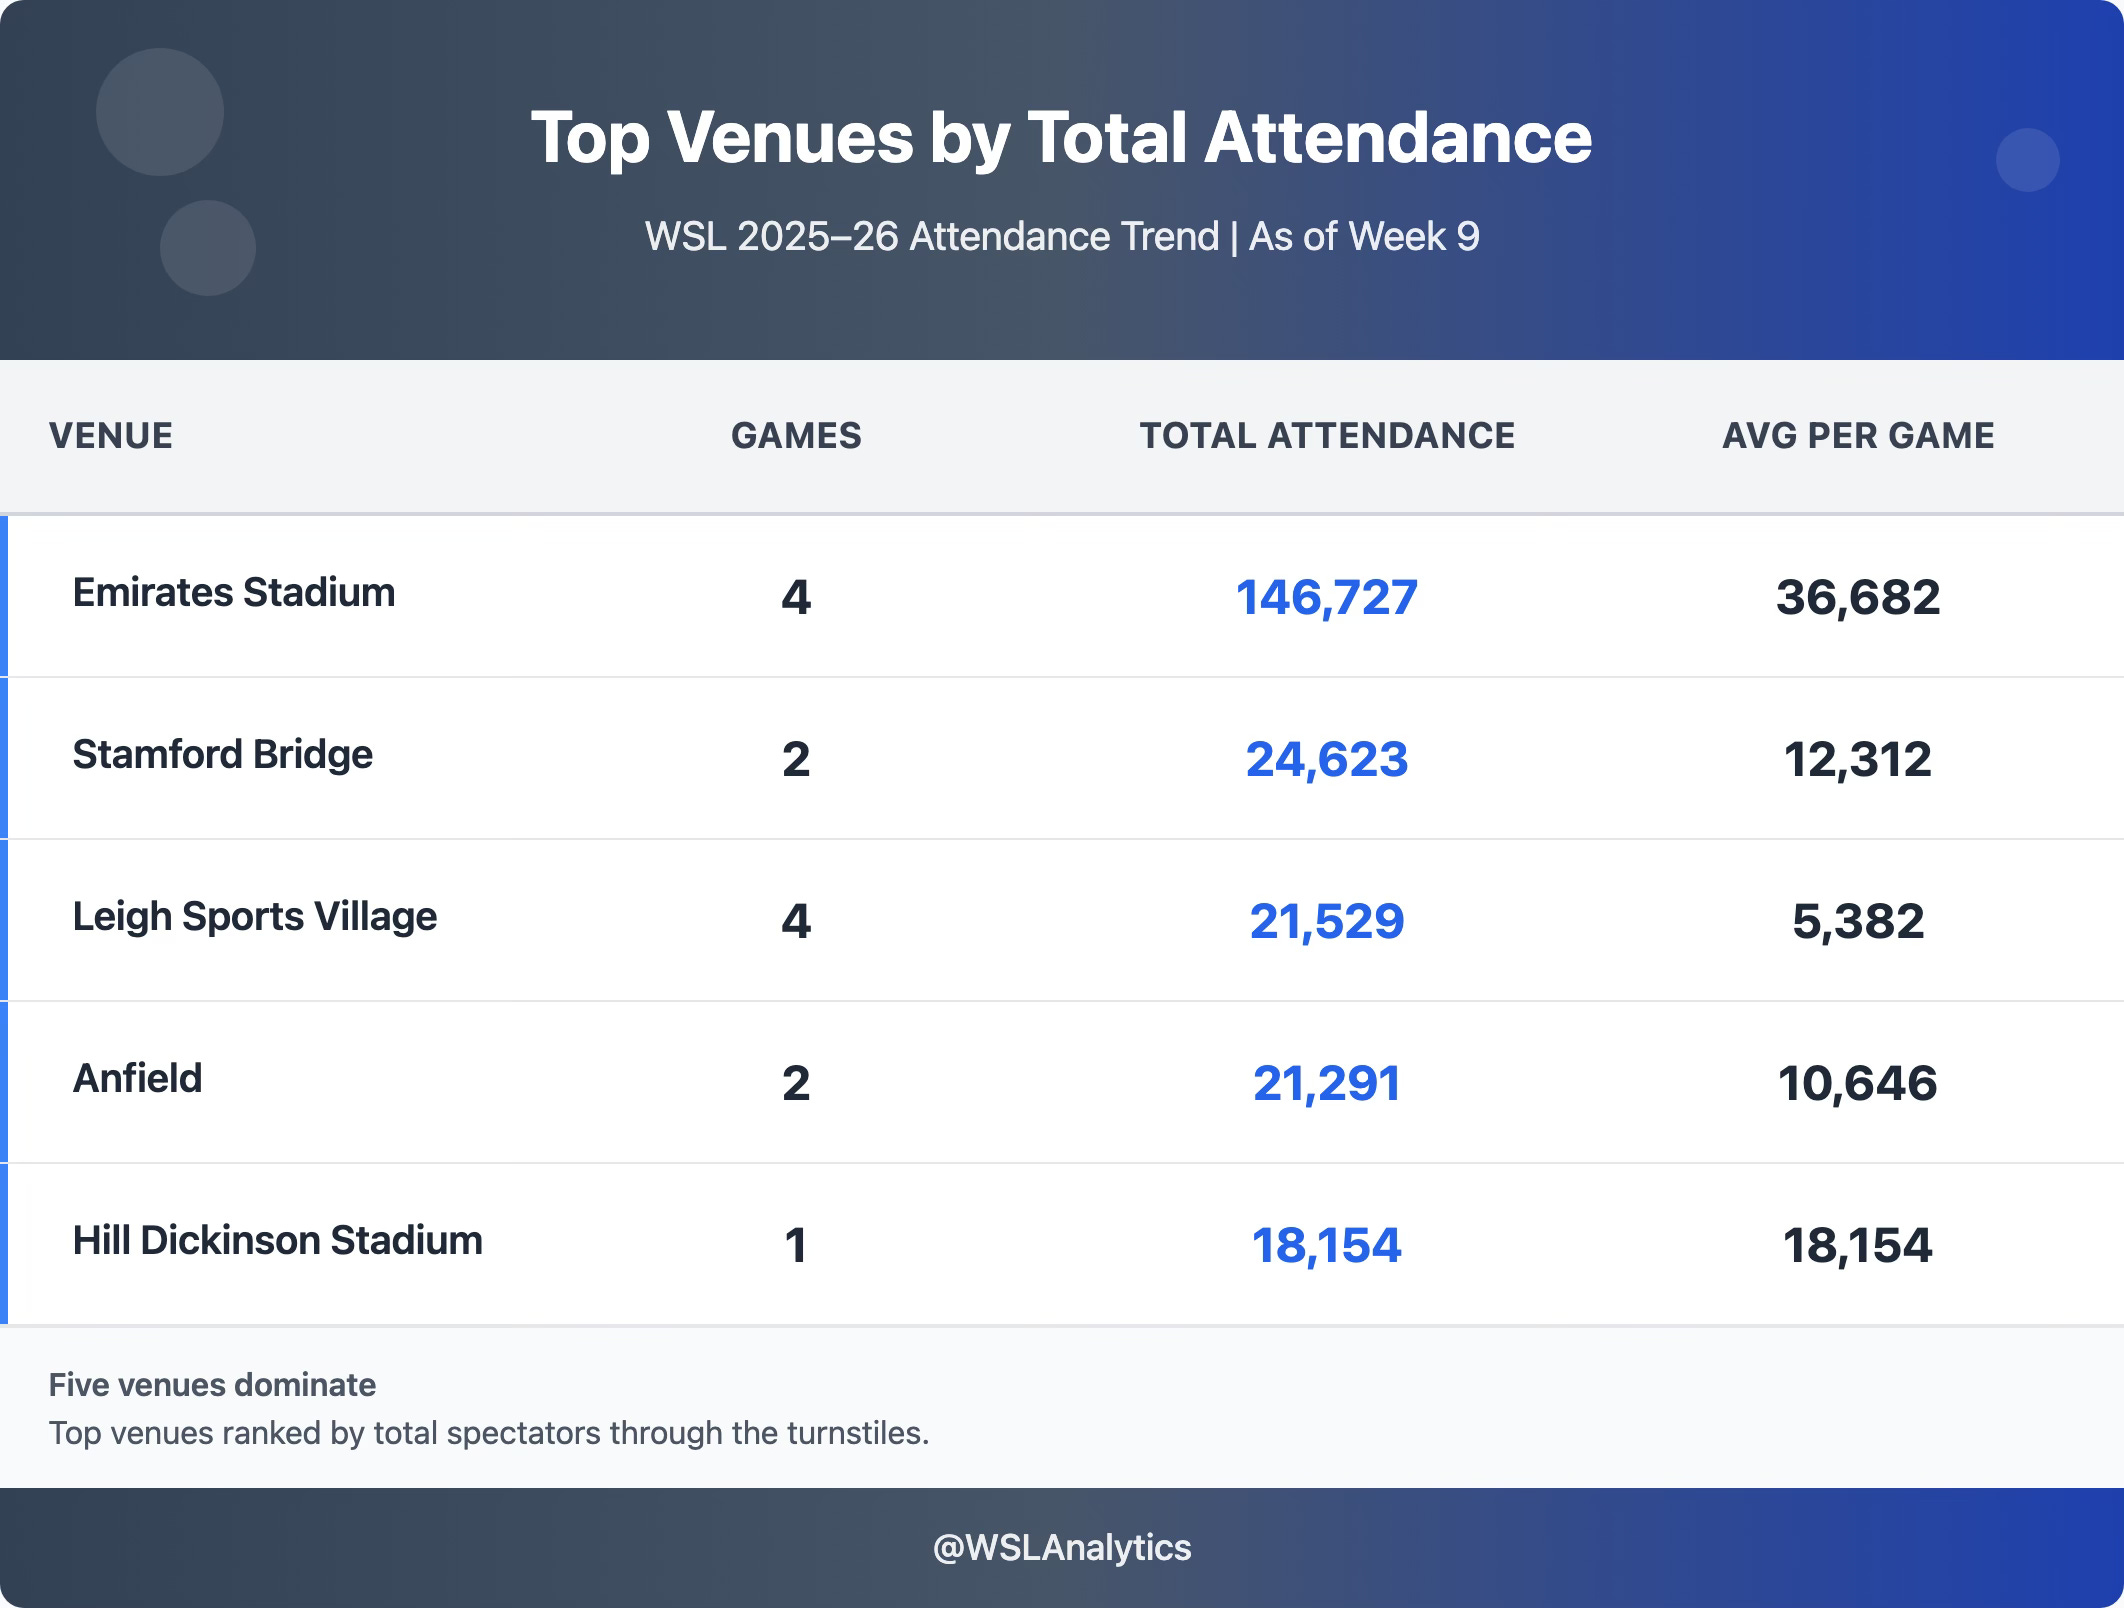
Together, these five grounds account for 232,324 spectators – 64.6% of all attendance in the dataset.
On its own, Emirates Stadium hosts 146,727 fans across four games – about 40.8% of all spectators – that is a staggering level of concentration.
2.2 Big stages vs core WSL grounds
If you split venues roughly into two buckets:
“Big stages” – Emirates, Stamford Bridge, Anfield, Etihad, Hill Dickinson, Goodison Park, Villa Park, King Power, American Express
“Core WSL / satellite grounds” – Leigh Sports Village, Joie Stadium, The BetWright Stadium, Chigwell, Broadfield, Copperjax, Cherry Red, Totally Wicked, etc.
Figure 2 shows how lopsided that split is – just 16 big-stage games account for roughly two-thirds of total attendance.
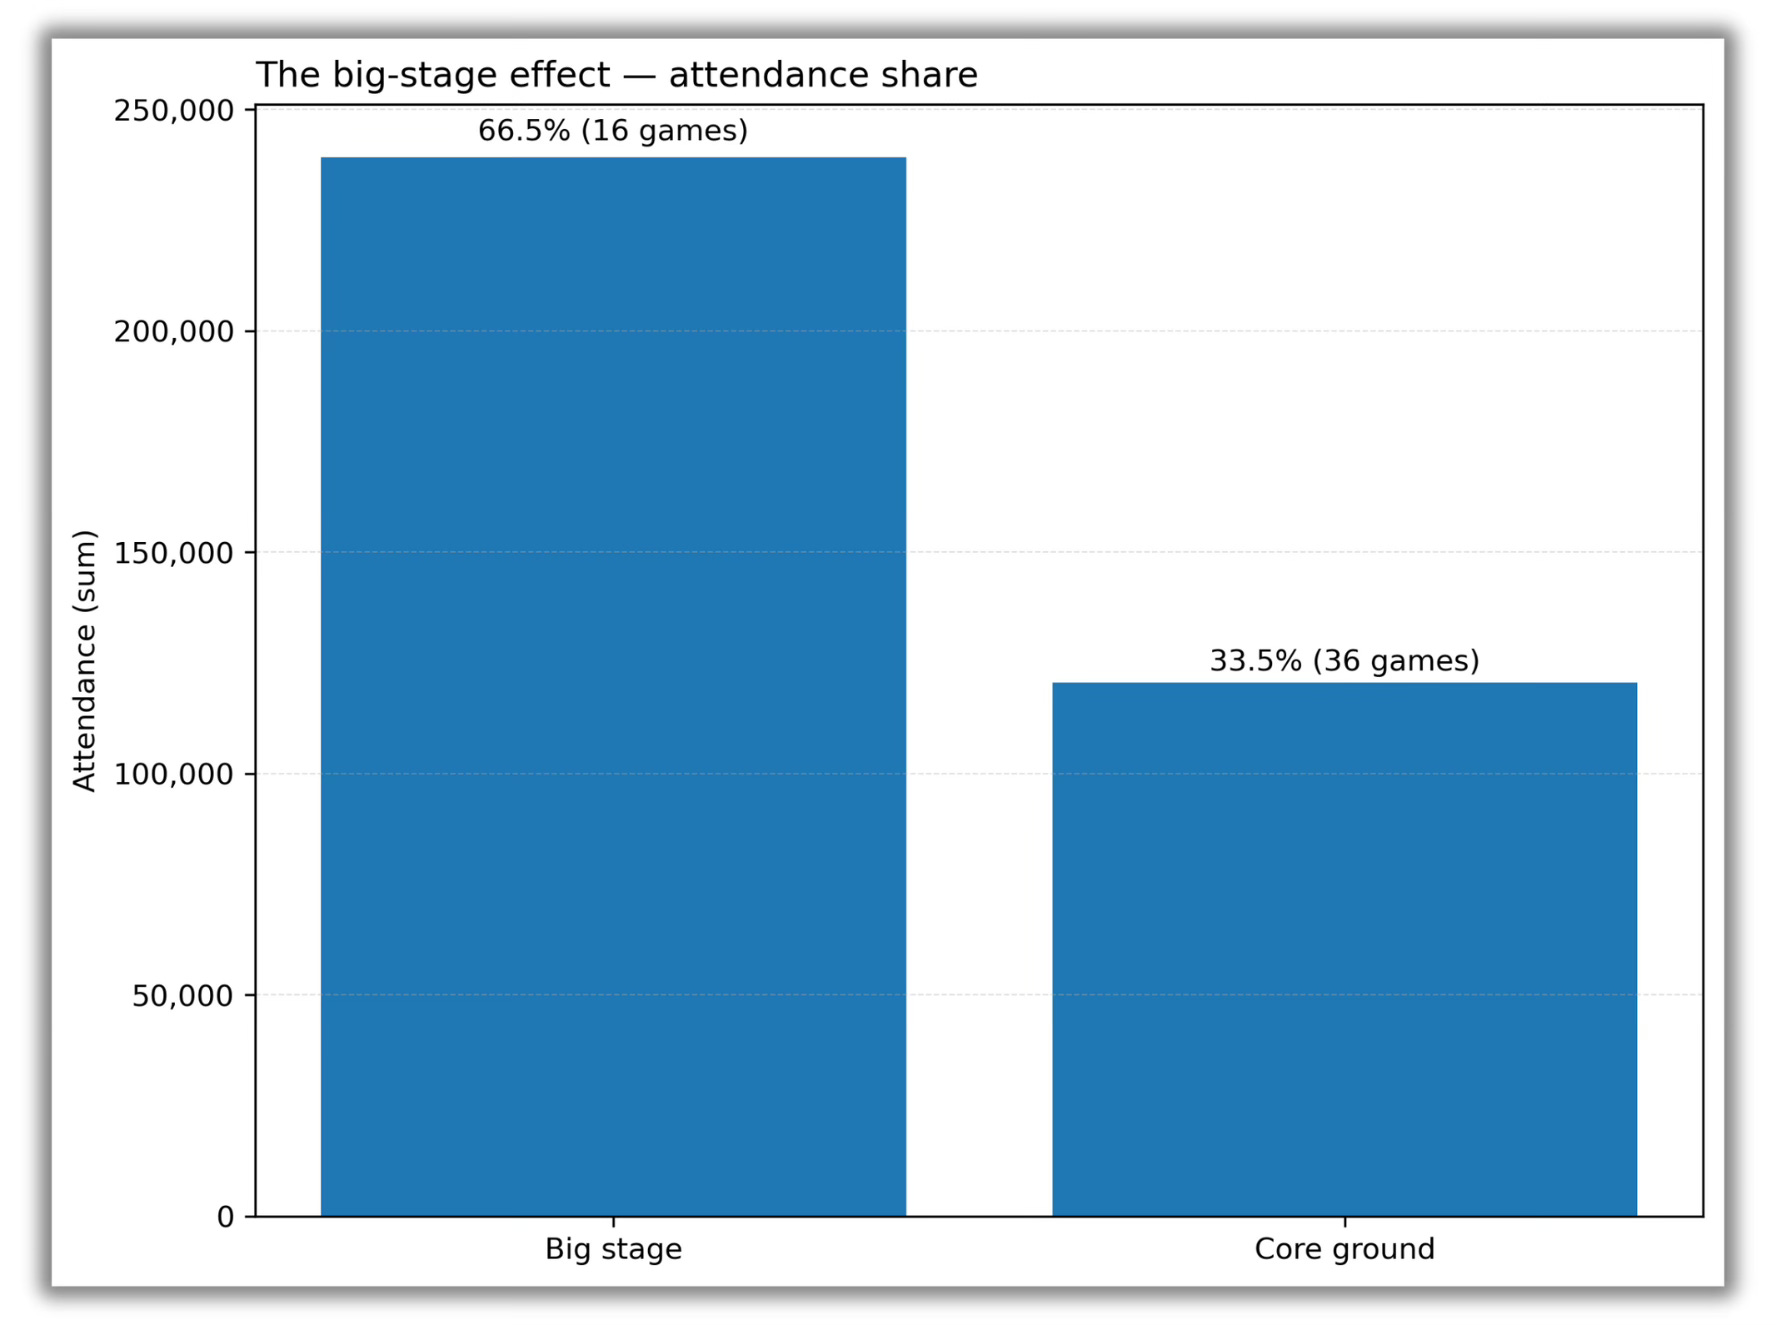
Figure 2 – The big-stage effect. Big stadiums account for roughly two-thirds of total attendance from only 16 games.
There is a familiar pattern:
Big stages regularly deliver 10k–35k+ crowds.
Core grounds mostly sit in the 2k–5k band, with a few fixtures dropping under 2,000.
The league-wide averages are not “typical” WSL crowds – they’re a blend of everyday gates and a handful of mega-events in men’s main stadiums.
3. City lens – London and the northern clusters
3.1 London’s dominance
London – 14 matches, 191,748 total
Average: ≈ 13,696
Median: 4,794
Share of all spectators: 53.3%
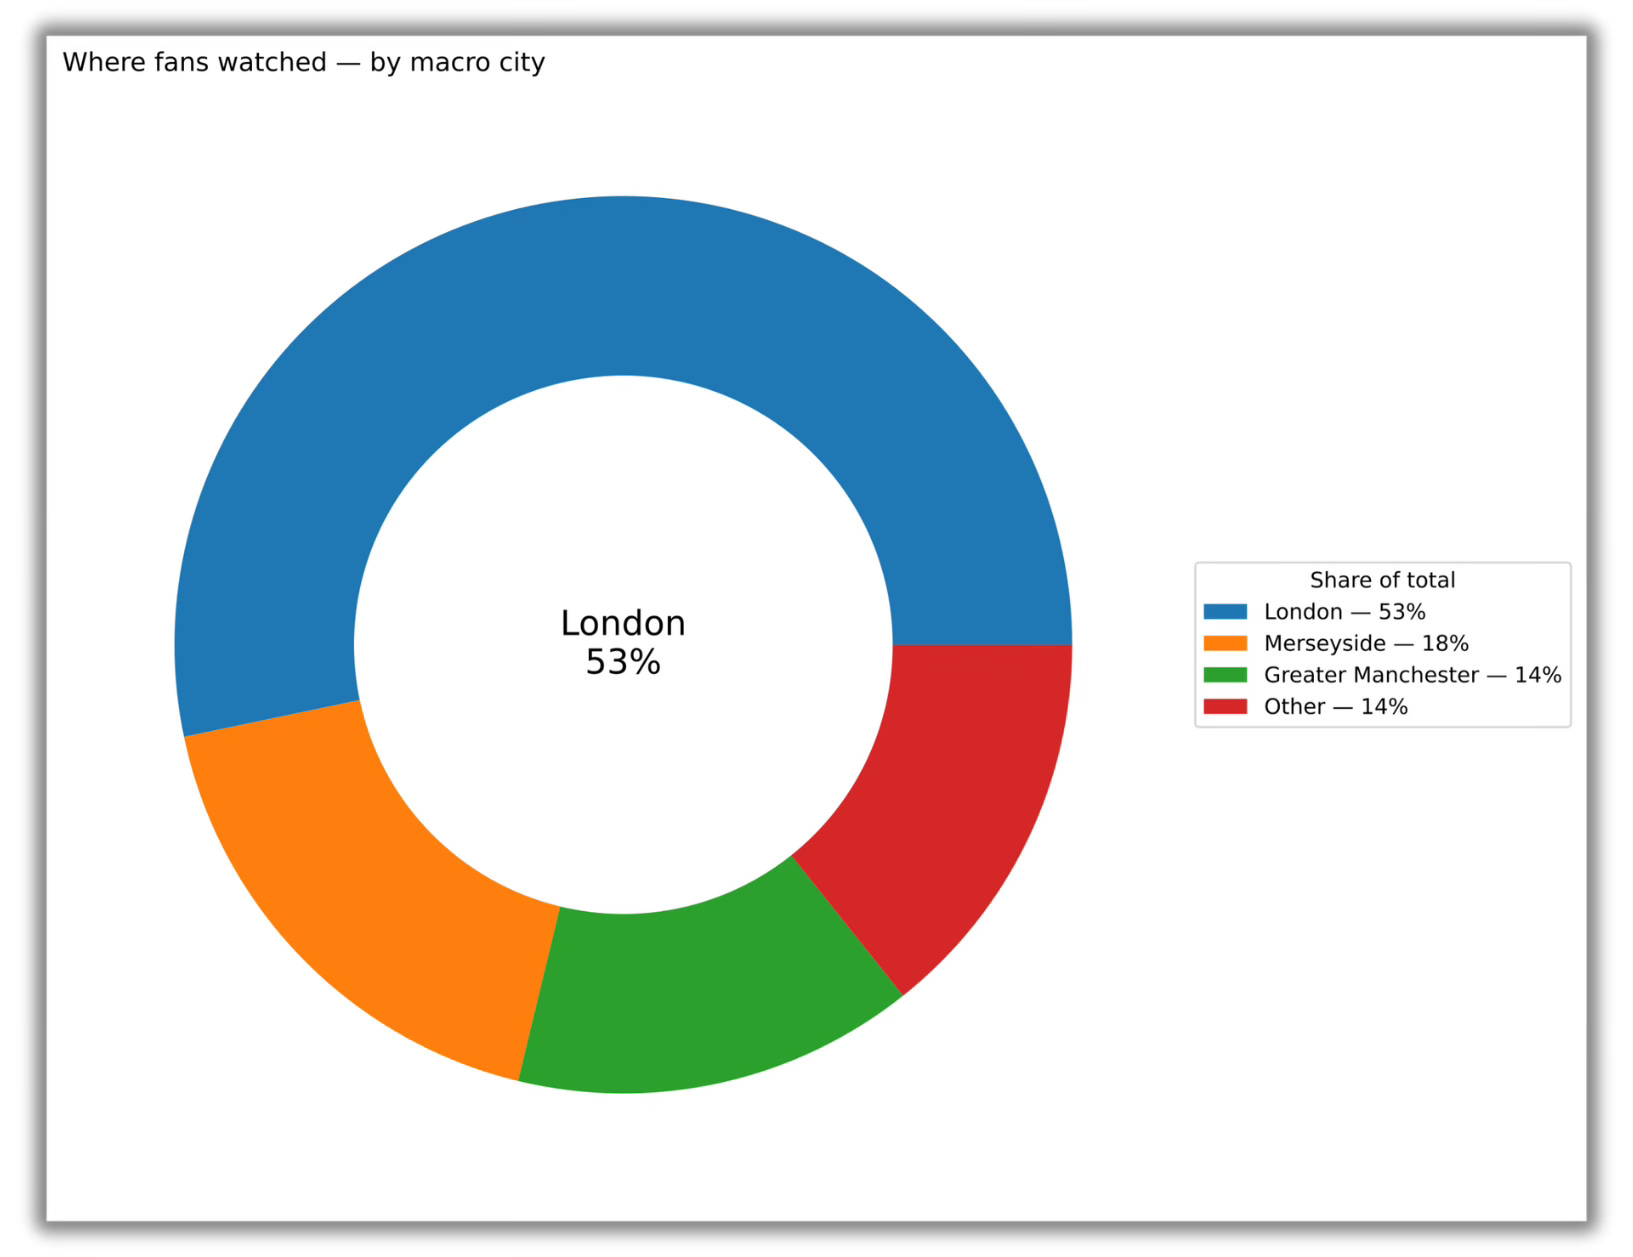
Figure 3 – Where fans watched. London accounts for just over half of all WSL attendance in this sample, with Merseyside and Greater Manchester providing most of the rest.
More than half of all fans in the data watched WSL football in London.
That is partly Emirates and Stamford Bridge, but also the capital’s “core” WSL venues:
The BetWright Stadium (Spurs) – 5 games, 13,255 total (avg 2,651)
Copperjax Community Stadium (London City Lionesses) – 3 games, 7,143 total (avg 2,381)
Even inside London, two big stages (Emirates + Stamford Bridge) do most of the heavy lifting, with BetWright and Copperjax providing more “everyday WSL” crowds.
3.2 Merseyside and Manchester clusters
Grouping city entries into wider clusters:
Merseyside cluster
Cities: Liverpool, Merseyside, St Helens
9 matches, 64,566 total, ≈ 7,174 average
Share of all spectators: 17.9%
Manchester cluster
Cities: Manchester, Leigh, Greater Manchester
9 matches, 52,093 total, ≈ 5,788 average
Share of all spectators: 14.5%
Add those to London and you get a striking picture:
London + wider Merseyside + wider Manchester account for ~85.7% of all attendance in the sample.
WSL crowds are heavily centralised around a London–Merseyside–Manchester triangle, with the rest of the country operating at much smaller scales.
4. Club lens – Arsenal’s Emirates model, Everton and Chelsea’s uplift
Using the home team from each fixture:
4.1 Home attendances by club
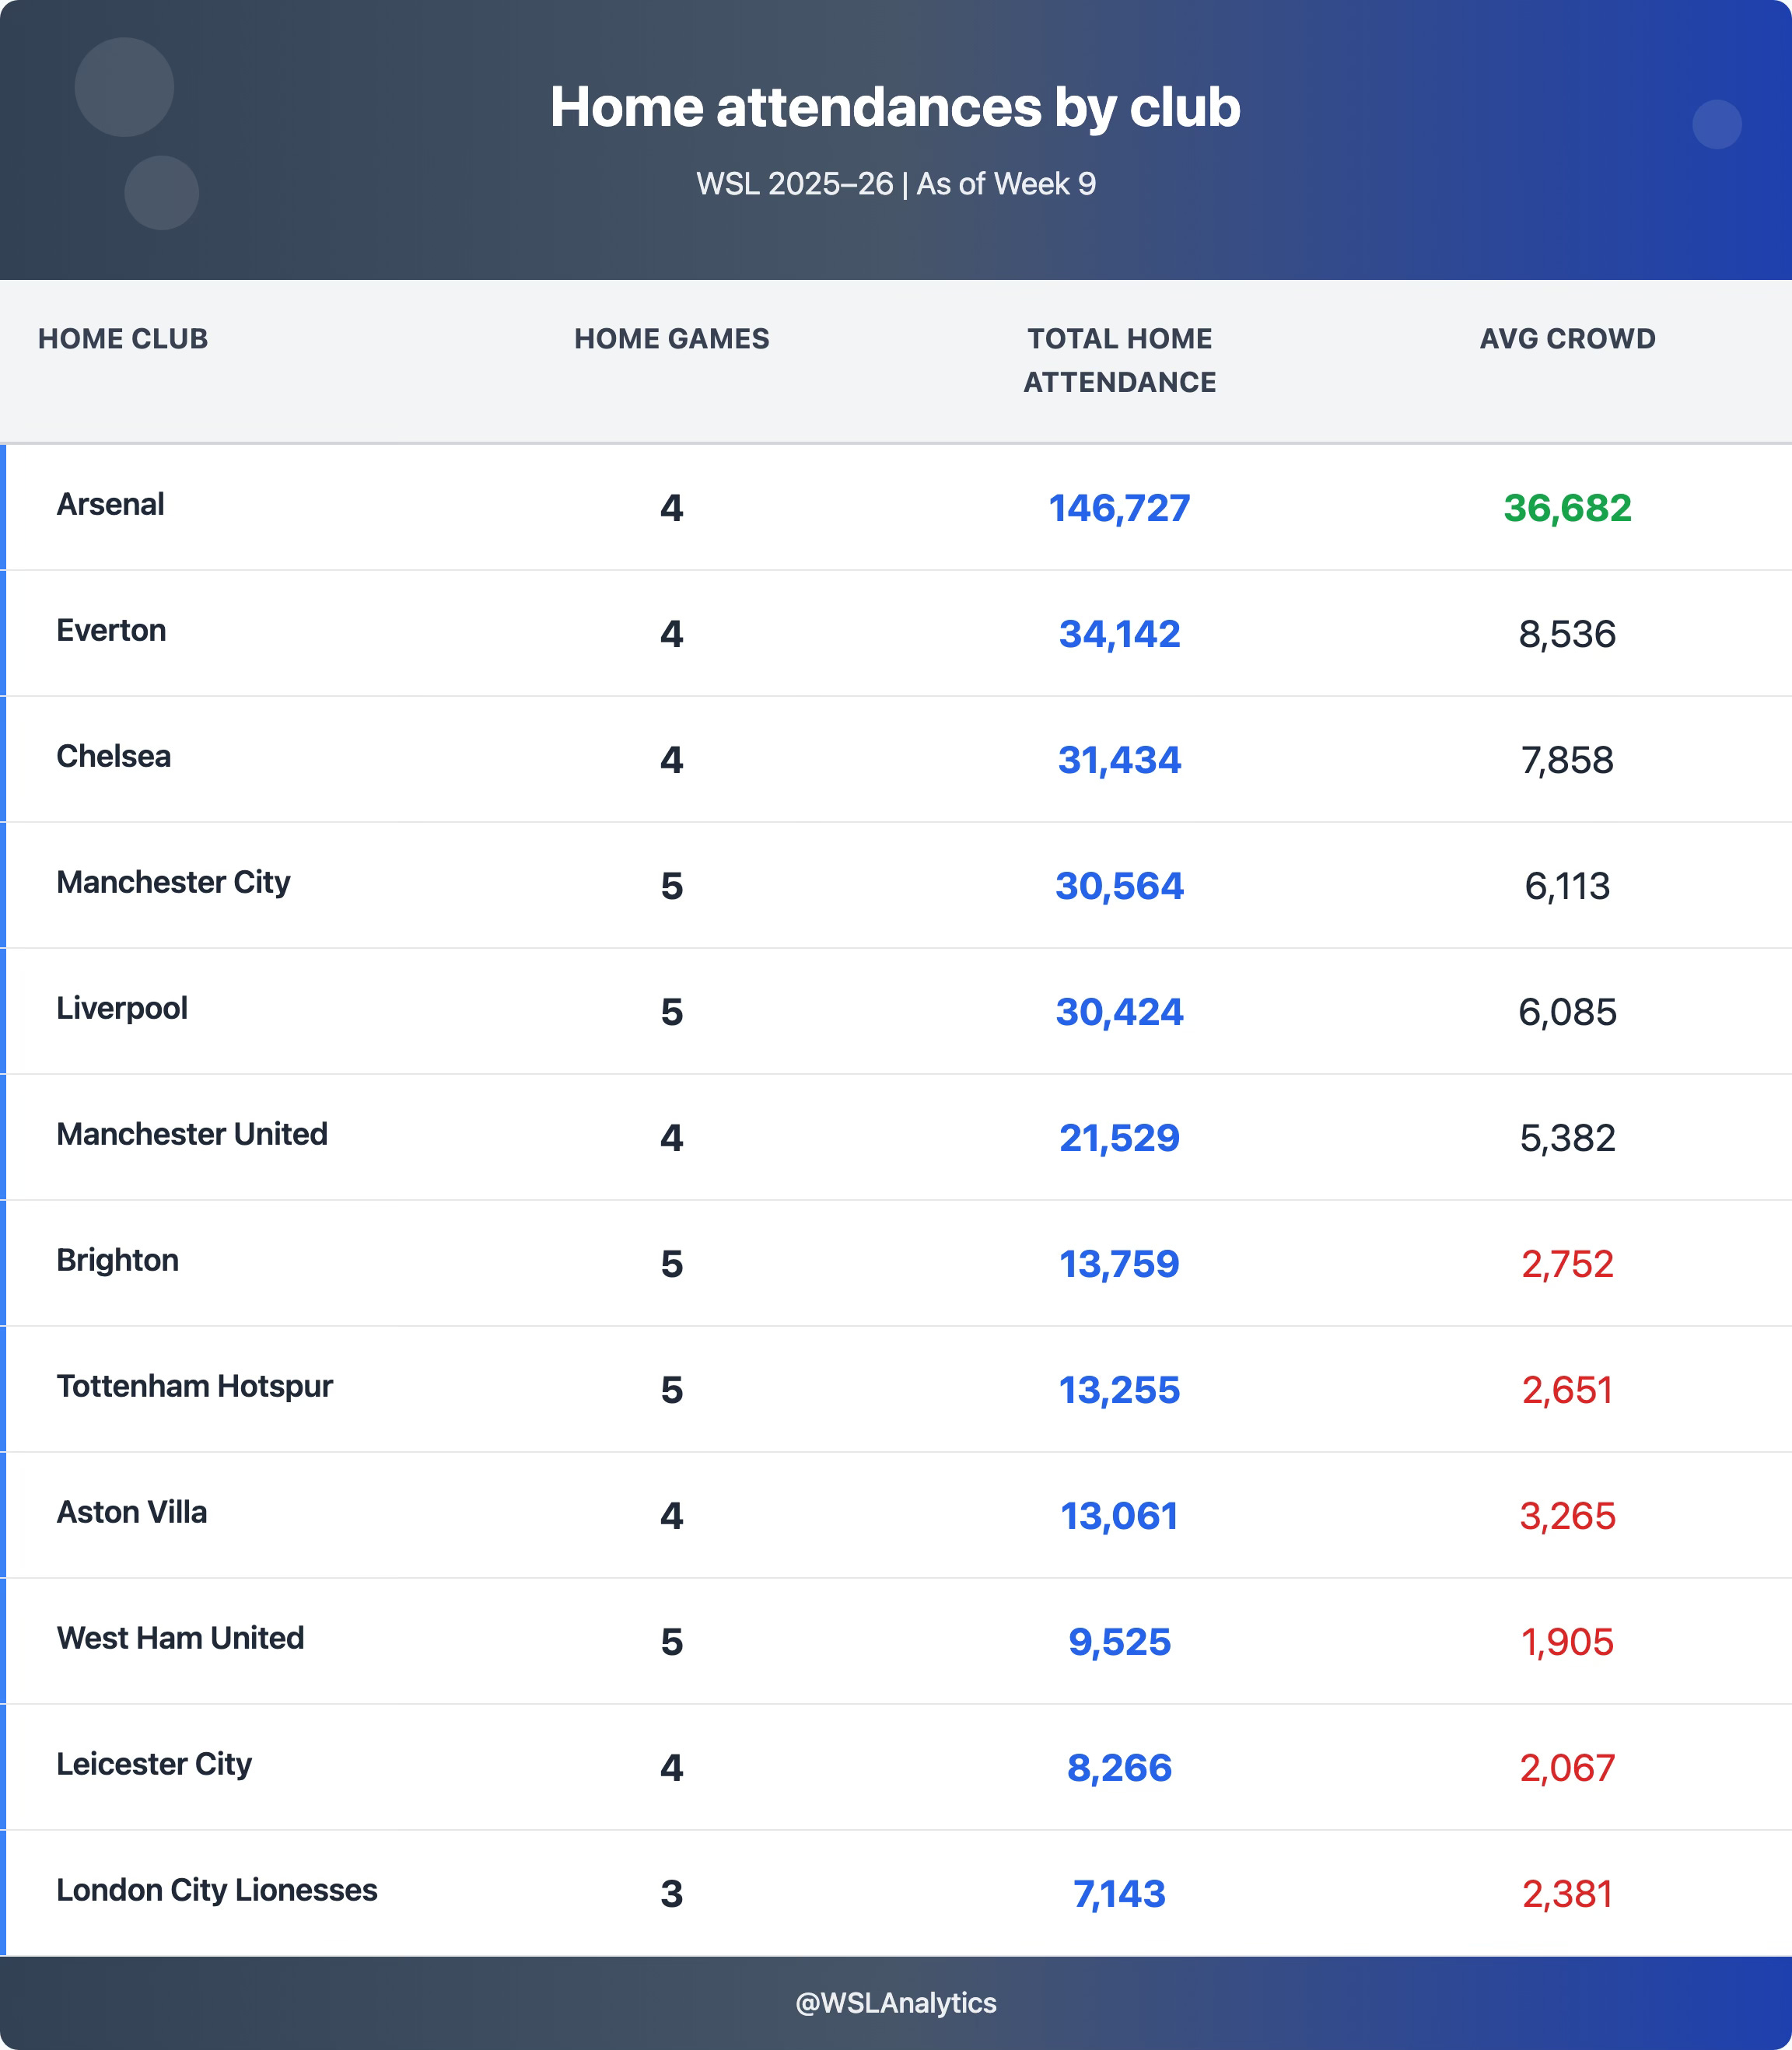
The top three clubs by home attendance:
Arsenal, Everton, Chelsea – combine for 212,303 spectators, which is 59.0% of all attendance in the dataset.
4.2 Big-stadium uplift – some concrete examples
A few clear “uplift” patterns emerge when you compare big stages with core grounds for the same club:
Chelsea – Stamford Bridge vs Cherry Red
Stamford Bridge: 2 games, 24,623 total (avg 12,312)
Cherry Red Records Stadium: 2 games, 6,811 total (avg 3,406)
Everton – Hill Dickinson vs Goodison Park
Hill Dickinson Stadium: 1 match, 18,154
Goodison Park: 3 matches, 15,988 total (avg 5,329)
Liverpool – Anfield vs Totally Wicked Stadium
Anfield: 2 matches, 21,291 total (avg 10,646)
Totally Wicked Stadium (St Helens): 3 matches, 9,133 total (avg 3,044)
Manchester City – Etihad vs Joie Stadium
Etihad Stadium: 1 match, 17,520
Joie Stadium: 4 matches, 13,044 total (avg 3,261)
Across all of these, the pattern is consistent:
When clubs shift WSL fixtures into their main or larger stadiums, attendances jump to three–four times their typical core-ground levels.
Arsenal are now a special case: all four home games in this dataset are at the Emirates. Their entire home attendance model is built on big-stage football.
5. Fixture extremes – from 56k at the Emirates to sub-1.2k at the King Power
5.1 Top 10 fixtures by attendance
The ten biggest crowds in the dataset:
Arsenal vs Chelsea – Emirates – 56,537 – 12:00
Arsenal vs London City Lionesses – Emirates – 38,142 – 13:30
Arsenal vs Brighton – Emirates – 27,336 – 14:30
Arsenal vs Aston Villa – Emirates – 24,712 – 12:00
Everton vs Manchester United – Hill Dickinson – 18,154 – 12:00
Manchester City vs Manchester United – Etihad – 17,520 – 13:30
Chelsea vs Manchester City – Stamford Bridge – 14,182 – 19:30
Liverpool vs Everton – Anfield – 11,904 – 12:00
Chelsea vs London City Lionesses – Stamford Bridge – 10,441 – 12:00
Liverpool vs Manchester City – Anfield – 9,387 – 16:45
What they have in common:
Heavyweight fixtures – derbies, top-four clashes, or high-profile London ties.
Big venues – Emirates, Etihad, Stamford Bridge, Anfield, Hill Dickinson.
A mix of midday and afternoon kick-offs, plus one evening slot.
Five of the top ten are scheduled at 12:00, which reinforces a key theme:
The slot itself isn’t special – it’s the combination of fixture and venue sitting in that slot.
5.2 Bottom 10 fixtures by attendance
At the other end of the scale:
Leicester City vs Everton – King Power – 1,119 – 11:55
West Ham vs Everton – Chigwell – 1,139 – 12:00
West Ham vs Leicester – Chigwell – 1,194 – 12:00
West Ham vs Aston Villa – Chigwell – 1,286 – 11:55
Leicester vs Spurs – King Power – 1,404 – 12:00
Spurs vs Brighton – BetWright – 1,427 – 11:55
Spurs vs Manchester City – BetWright – 1,631 – 19:30
Spurs vs Liverpool – BetWright – 1,674 – 12:15
Brighton vs Everton – Broadfield – 1,722 – 12:00
Spurs vs West Ham – BetWright – 1,735 – 12:00
Recurring patterns:
Clubs: Leicester, West Ham, Spurs, Brighton appear repeatedly.
Venues: King Power, Chigwell, BetWright, Broadfield – all in the “core ground” bucket.
Times: 11:55–12:15 slots dominate the low-attendance list.
It’s not that these clubs never draw bigger crowds – Spurs, Brighton and Leicester all appear in larger games elsewhere – but their routine home fixtures at core venues, especially very early kick-offs, are struggling for traction.
6. Kick-off times – why the clock is a secondary factor
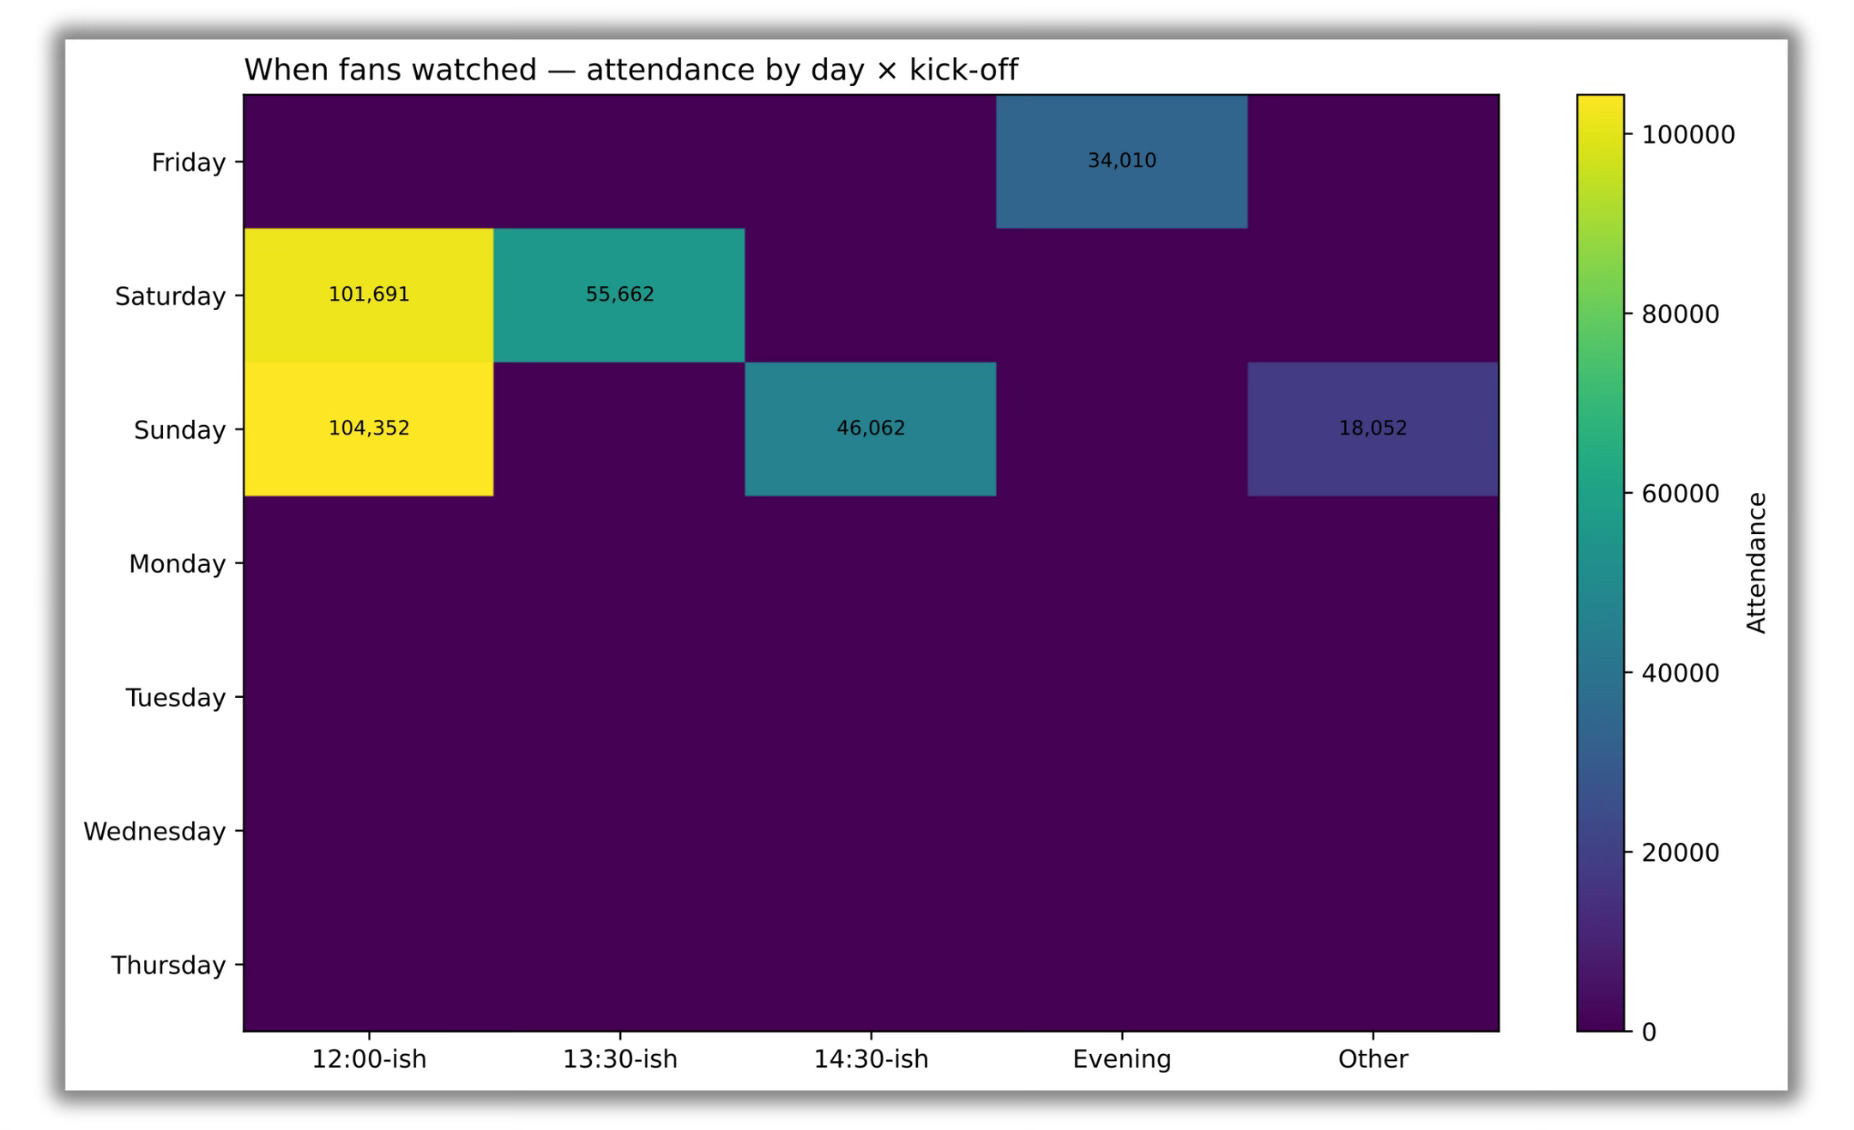
Figure 4 – When fans watched. Attendance is concentrated in weekend 12:00 slots and a small cluster of high-profile 13:30 and 14:30 games, with Friday evenings providing a smaller but visible share.
From the time-only analysis, we find that:
12:00 is the workhorse slot – 32 games, 198,066 total attendance (avg 6,190).
13:30 is rare but enormous – 2 games, 55,662 total (avg 27,831).
14:30 and 16:45 are strong mid-afternoon slots.
11:55 and 12:15 are weak performers.
Grouping into broader buckets:
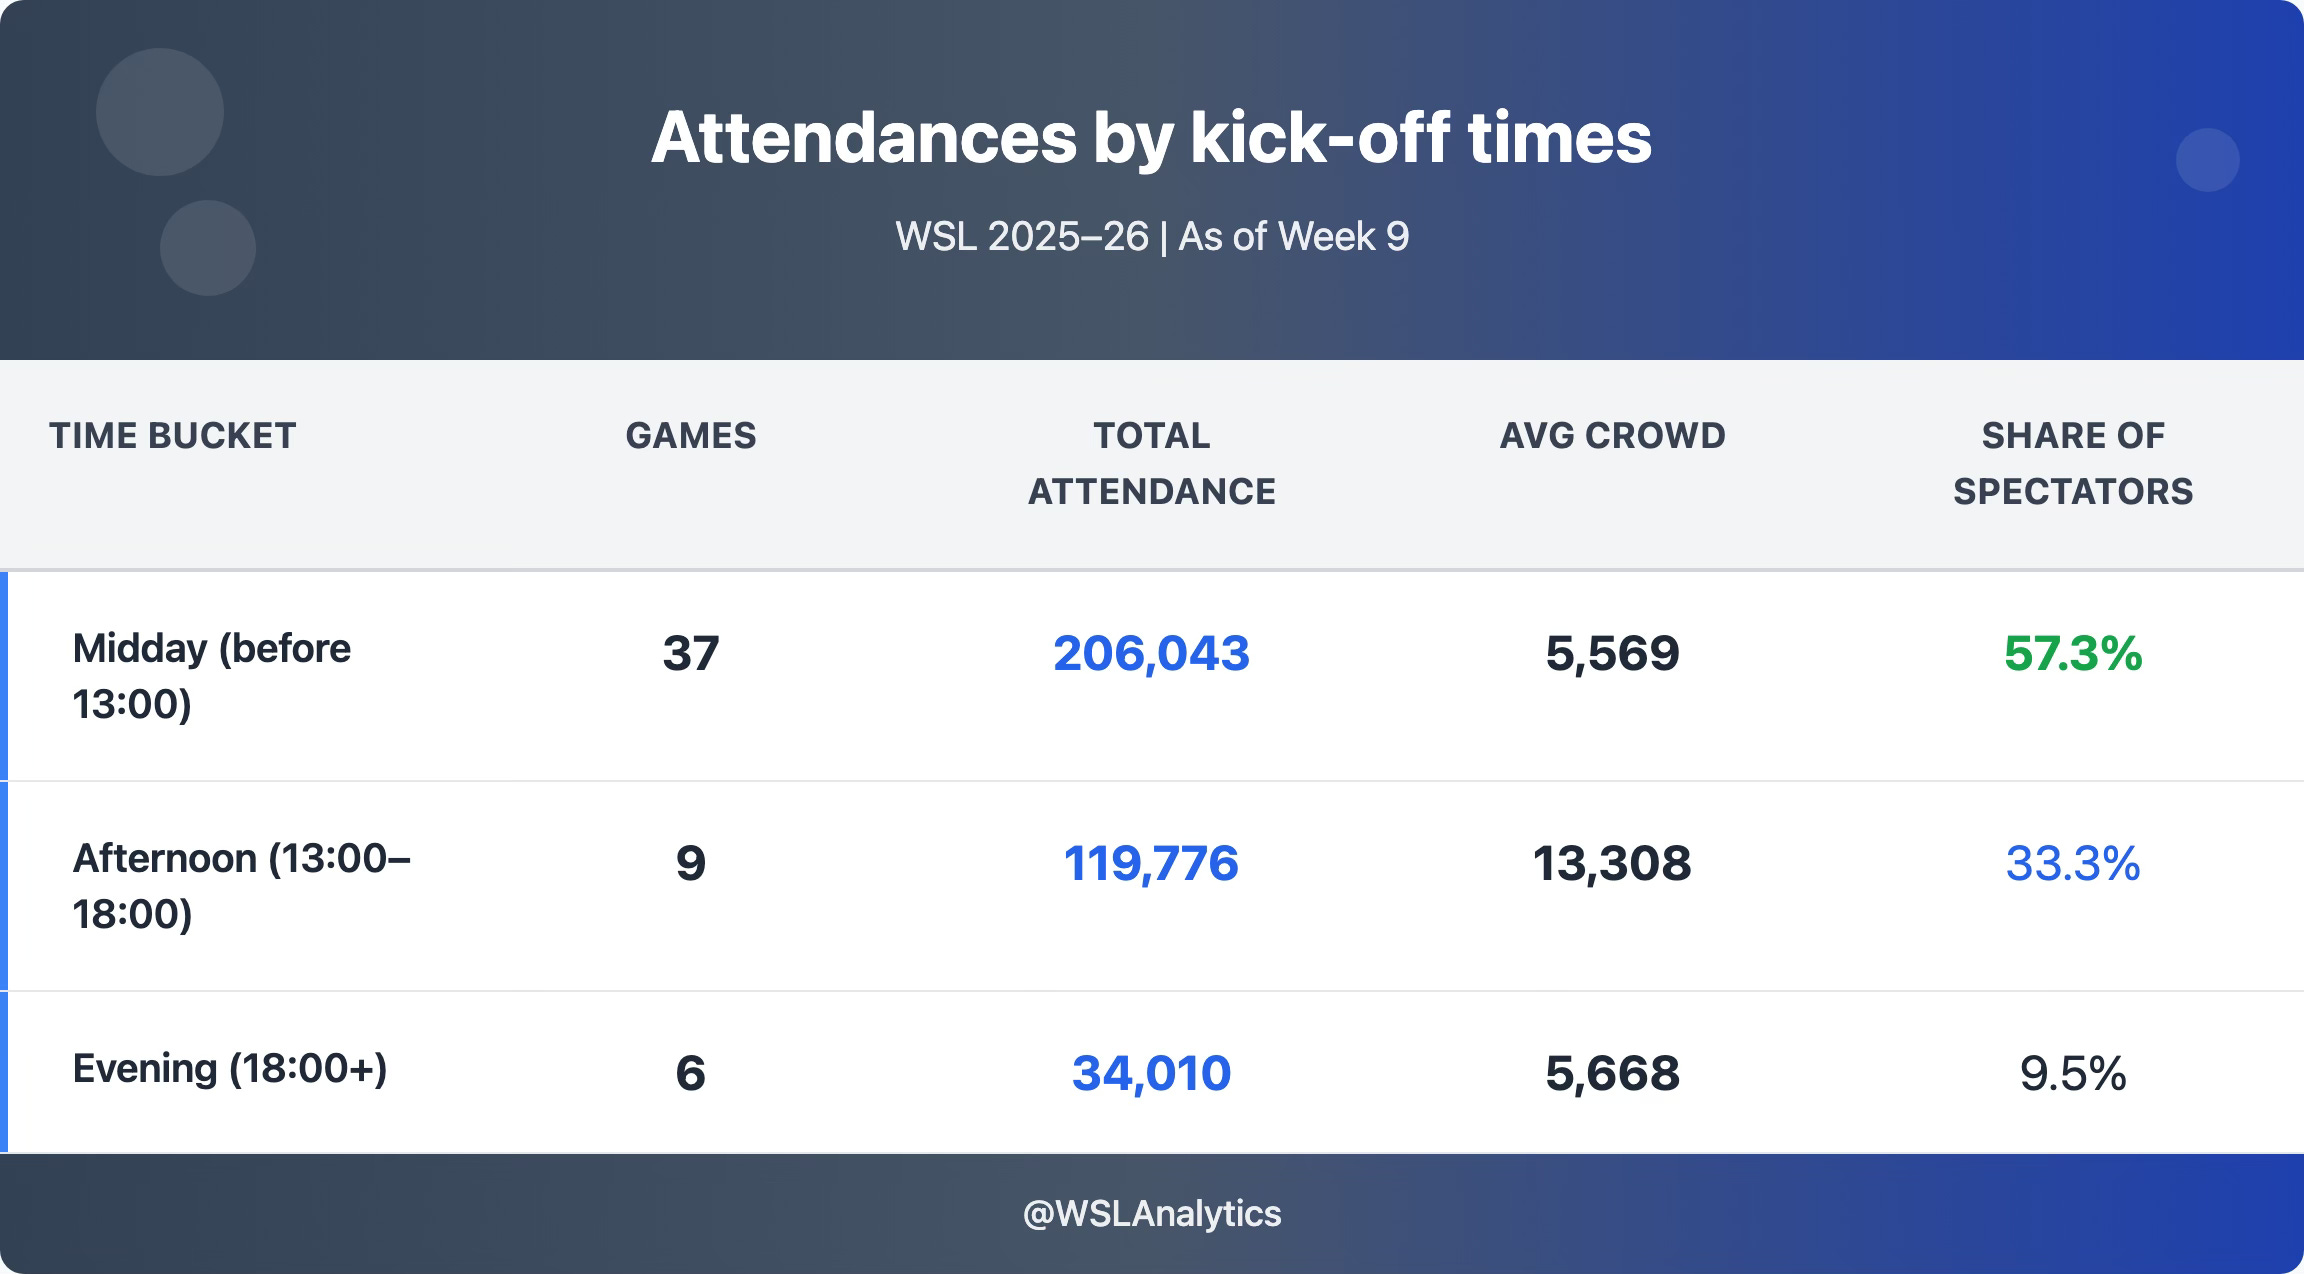
Afternoon games look fantastic on paper – nearly 2.5× the average of midday or evening slots – but almost all of that uplift comes from:
Arsenal at the Emirates
Manchester derbies at the Etihad
Other big fixtures moved into larger stadiums.
The weakest segment is the set of very early kick-offs:
11:55 + 12:15 combined: 5 matches, 7,977 total
Average crowd: ≈ 1,595
Median: 1,427
So the more accurate statement is:
Kick-off time matters, but mainly as a multiplier of fixture and venue.
Early-midday games at smaller grounds struggle; afternoon slots at big stadiums supercharge headline fixtures.
7. What this means – for the league and for future coverage
7.1 For the WSL and clubs
A few practical implications from this early-season snapshot:
Big-stadium strategy is working – but it’s also doing a lot of heavy lifting.
Emirates alone accounts for 40.8% of all spectators here.
The league’s headline numbers are extremely sensitive to a small handful of games.
London remains the gravitational centre of WSL attendances.
Over half of all fans in this sample watched matches in London.
Merseyside and Manchester provide strong secondary hubs, especially when Liverpool, Everton, City and United move games into bigger grounds.
Core-ground fixtures need a different playbook.
Repeated sub-2k attendances at Chigwell, King Power, BetWright and Broadfield – especially at 11:55–12:15 – suggest there’s still work to do on pricing, marketing, local engagement and scheduling.
Derbies and marquee ties are the clear levers for growth.
Almost every entry in the top-10 attendance list is a derby or title-relevant clash in a big stadium.
If the WSL wants to keep pushing record-breaking crowds, these are the fixtures to target.
8. Wrapping up
The headline story from this early-season 2025–26 sample is simple:
A small set of big-stadium, big-fixture games is carrying a huge share of the WSL’s total attendance.
Most “everyday” WSL fixtures still look and feel like a 2–5k product.
Neither of those facts is inherently good or bad – but together they define where the league stands today.
In future Inside the Stands pieces I’ll dig further into:
Club-by-club home attendance profiles, and
How attendance interacts with on-pitch performance (results, xG, title races, relegation battles).
For now, the message from the stands is clear:
Get the right fixture into the right stadium at the right time, and WSL crowds will turn up – in serious numbers. The task now is spreading that effect beyond a handful of headline dates.
If you found this recap insightful, please consider subscribing and sharing, and join the conversation on X (Twitter) @WSLAnalytics for more WSL analysis throughout the season.